ISSS608 2016-17 T1 Assign1 Ong Han Ying
Contents
Abstract
As of Oct 2015 [1] [[1]], over 80% of Singapore’s resident population lived in public housing of Singapore. In all, there are mainly 2 methods to buy a flat in Singapore, either buying a new flat, or a resale flat. Resales flats are highly sought after, due to availability at any locations, and purchases are allowed from the open market anytime. As such, prices of resales flat are highly subjected to the changes in the demand & supply in the resales market. In this analysis, we will create infographics that highlights the key trends between Q1 & 2 of 2015 and 2016 in the resales market in Singapore – to help the stakeholders to make related decisions.
Problem and Motivation
Due to the nature of an open market of the sales & purchases resales flats, the changes in the prices are closely monitored by various stakeholders. For instance, it is common for the news to be reporting the monthly changes in resales flat's price. [2][[2]]
The stakeholders include policy makers, buyers, sellers,housing agents and so on. Each of the stakeholders have different interests in mind, and thus; will observe the trend differently. For instance, there are buyers who are looking for a new home urgently, or speculators. In this analysis, we will focus the analysis for the buyers who are keen to purchase a re-sales flat in the re-sales market.
Analytical Questions
In all, this analysis will provide the answer to the following questions;
- What are the shares of the resale public housing supply in 2015?
- What are the distribution of the resales public housing prices in 2015?
- With reference to the findings, compare the patterns of the first-half of 2016 with the pattern of 2015.
Infographic
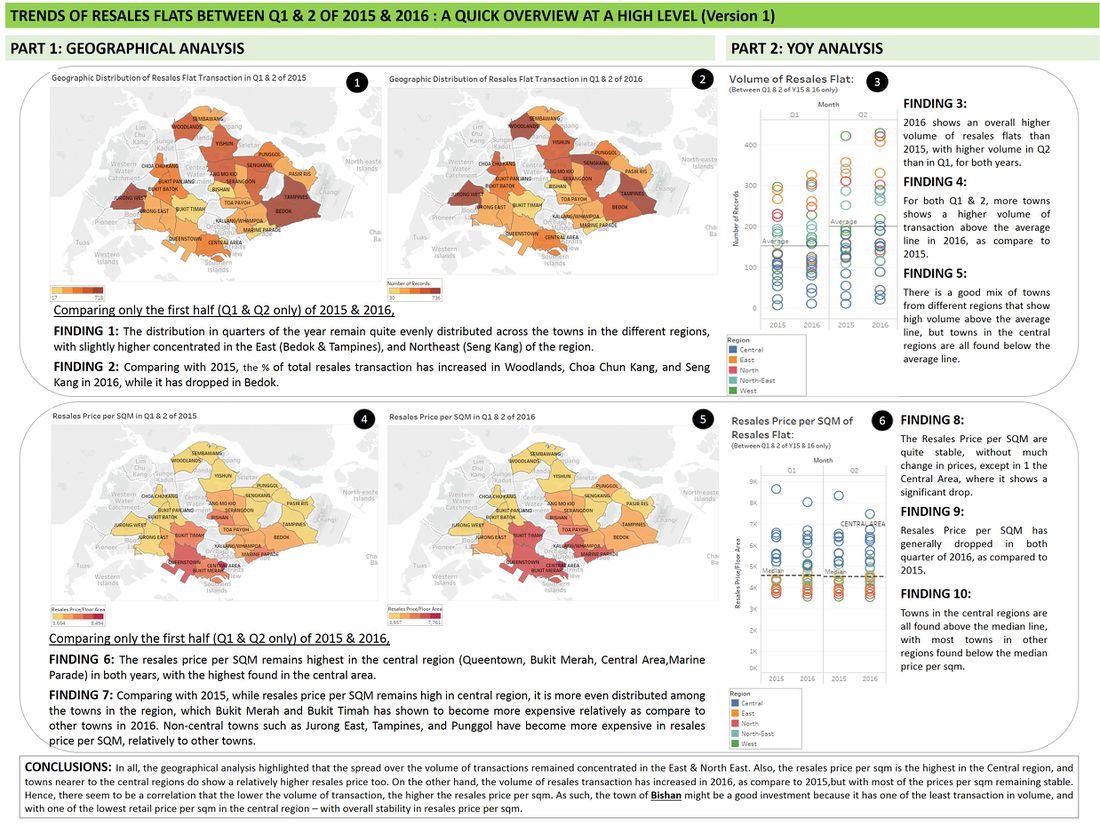
In all, 2 versions of infographic are created for 2 distinct group of readers; (1) High-Level Overview : For readers who want to have a quick overview on the general trend of the re-sales flat markets. (2) Breaking Down Resales Flat :For readers who required more analysis in the re-sales flat markets to guide them to make a decision.
Version 1 : High Level Overview
- To have a larger view of the file, please click [[3]], and click on the image again, to have a zoom out view.
Version 2 :
Approaches
Dataset
About the Dataset
The sources of the data are;
- Resales Flat Price from data.gov.sg [[4]]
- Number of Resale Applications Registered by Flat from data.gov.sg [[5]]
- Median Resale Prices for Registered Applications by Town and Flat Type from data.gov.sg [[6]]
- Resales Statistics from hdb.gov.sg [[7]]
- Planning Areas of Singapore from Wikipedia [[8]]
Data Preparation
Tools Utilised
The tools are that used are (1) Tableau 10, and (2) Microsoft Excel 2013
