ISSS608 2016-17 T1 Assign1 Ho Li Chin
Abstract
Singapore’s public housing system has been cited as a critical part in Singapore’s development landscape. Today, public housing is home to more than 80% of Singapore’s population. For the young couples who wish to start a family, instead of long waiting for new HDB flat to be ready, or some prefer to stay closer to their parents’ home, resale public housing has become a good choice for their dream home.
In this Assignment, data visualization will be used to gain some insights regarding the resale public housing market in Singapore. The analysis will focus on some common questions one would usually raise before buying buying resale housing for home. The questions are namely where to buy, price range, flat type, flat size and so on. The dataset that used in this Assignment is the Resale Flat prices records from March 2012 to Jun 2016 took from data.gov.sg.
Problem and Motivation
Buying a house is an expensive investment in Singapore. Most of us want to get the best deal when purchasing a house. The typical questions are categorized into 3 macro areas to address most of the buyers’ concerns prior to making an informed decision.
1) Is Resale purchase the better option?
- Resale transaction over years, what is the next outlook?
- Resale Price Index, Up or Down?
2) Affordability vs Location - Which area(s) sell best (based on transaction volume) - Which area(s) is the cheapest Resale Town (based on resale price) - Which area(s) is the most expensive Resale Town (based on resale price)
3) What type of resale HDB house to buy? - What type of flat to buy? 3-Room, 4-Room etc? - Age of the flat - Should I buy a small unit or bigger unit? - Should I buy a high floor unit?
Approaches
For the purpose to help the potential resale flat buyers, different visualization charts such as Bar Chart, Pareto Chart, histogram, time series analysis and box-and-whisker plot were used in this assignment.
Data Preparation
In teh audit of data from the dataset, some pre-calculations are done to compute the followings:-
- Date Format Conversion - Converted the original Date format in YYYY-MM (in String) to the Calendar format in Tableau.
DATE(dateparse("yyyy-MM", [Month]))
- Created a FloorSize bin classes to cluster the floor area into bin size of 20 Sq meter.
- Created $ price per sq meter = Resale Price ($) / FloorArea (in Sq meter)
Tools Utilised
Tableau 10 was mainly used for this data visualization.
Results
1) Is resale purchase a better option?
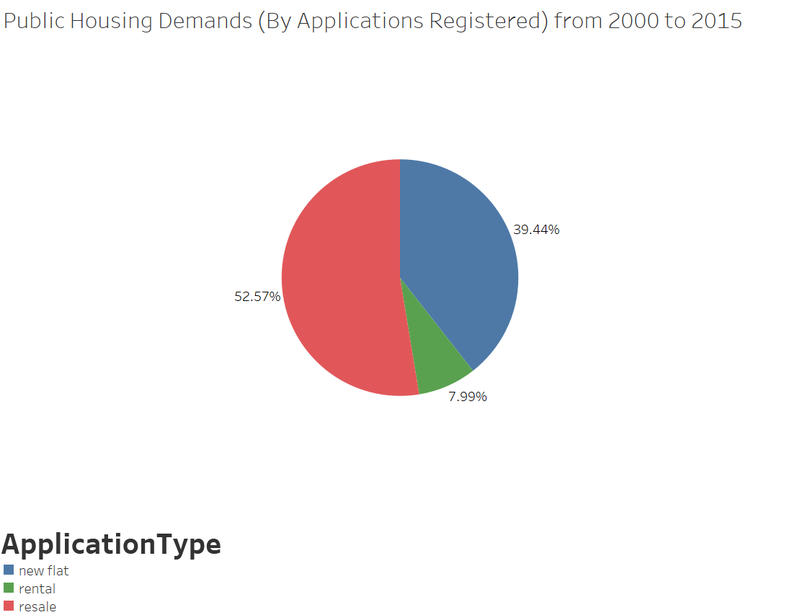
Firstly, let’s take a zoom out view on the shares of the resale public housing applications in Singapore.
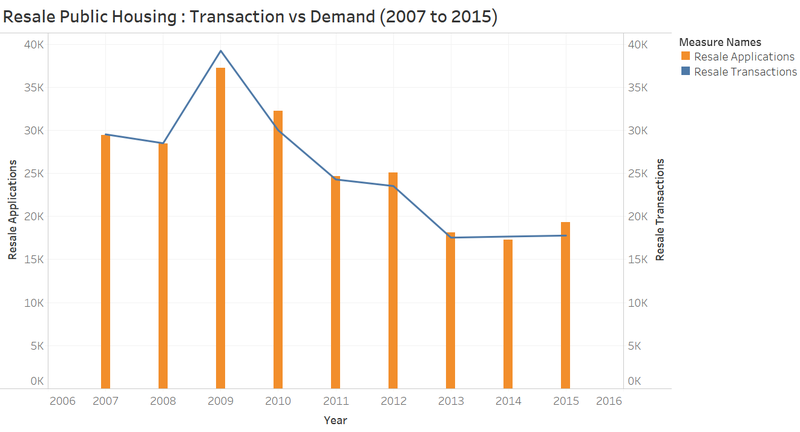
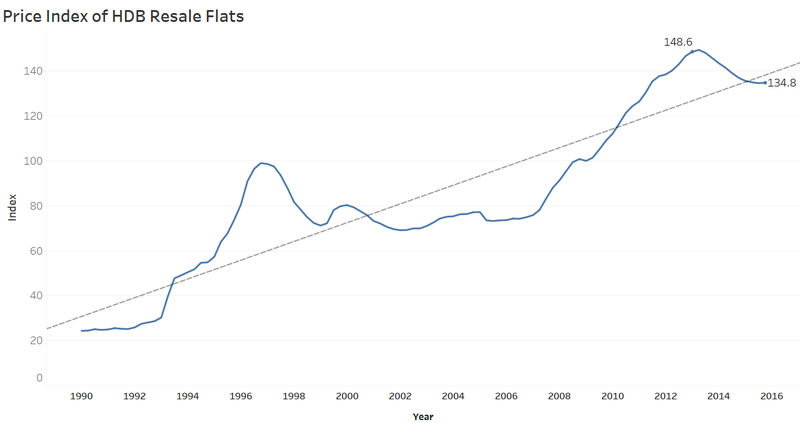
In Chart 1, we can have a rough gauge about the overall demand in terms of applications in Singapore public housing for the past years. We further zoom in to compare the number of Resale applications vs the Resale transactions from 2007 to 2015 in Chart 2, as well as the Resale Price Index in Chart 3.
Number of HDB resale flat transactions have been stabilized from year 2013 to 2015, after a significant drop of about 28% from 2012 to 2013.
As can be seen in the chart 3, Singapore HDB resale price index have dropped from 148.6 in 1Q2013 to 134.8 in 3Q2015. One point to note is that the price index has almost doubled from 2006 to 2013 which was probably due to the insufficient supply of new flats during that period. Since then, the government has been busy adjusting various housing cooling policies to address the public dissatisfaction due to the hike in housing price. The effect of cooling measures seems to take effect in for resale market from 2013. Let’s hope that prices won’t rise again too much.
Definition of Resale Price Index (RPI): RPI can be used to compare the overall price movements of HDB resale flats. It is calculated using resale transactions registered across towns, flat types, and models. The base period is the 1st quarter of 2009, i.e. RPI has a value of 100 in 1st quarter 2009. The index from 1Q 1990 to 3Q2014 are rebased to the new base period at 1Q2009. The index for 4Q2014 onwards is computed using the stratified hedonic regression method
2) Affordability vs. Location
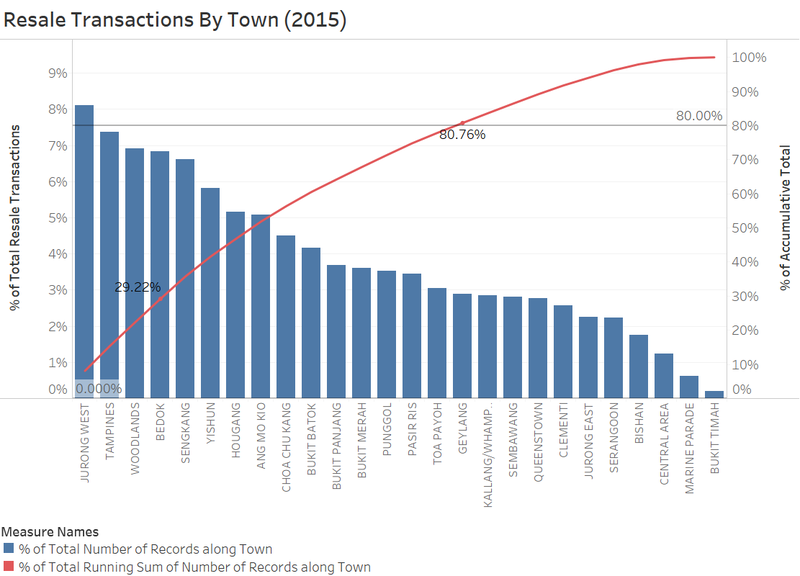
Chart 4 to 6 gives some insight information to help the buyers to weigh between affordability (in terms of the resale price) vs the location of the housing. For example, which town area(s) have most resale transactions in 2015, which is the more expensive vs the cheaper housing estate for consideration. We will also analyze on the Resale Price distribution by town area.
In Chart 4, Jurong West, Tampines, Woodlands and Bedok have contributed to about 30% of resale transactions in year 2015. On the other tail, Central Area, Marine Parade and Bukit Timah have the lowest number in resale transactions over the same period.
Next, Chart 5 presents the Resale Price Distribution by Town in 2015. From the distribution chart, it’s observed that the Resale Price distribution for all estate has the median in the range of The most expensive estate is Central area whereas the cheapest estate in terms of resale price is Yishun. In 2015, There are some estates which have some outlier in resale transaction which clinched the resale transacted price of more than 1 Million, for example Bishan, Central Area, Kallang/Whampoa.
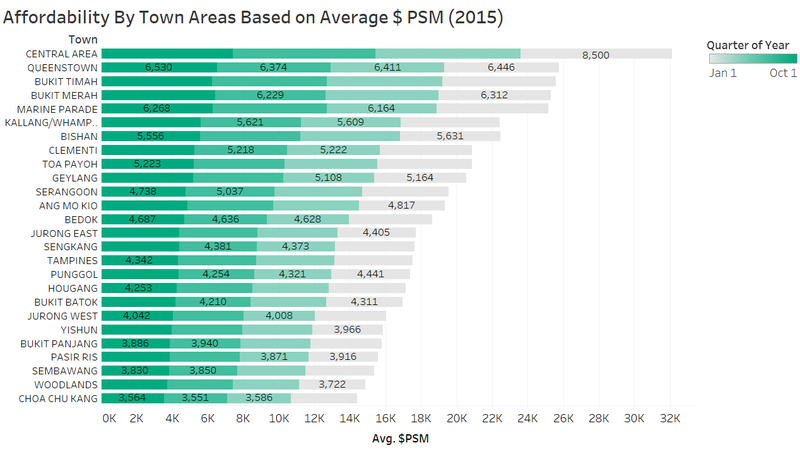
Chart 6 further look at the affordability in terms of Average $ per square meter by Town Area. Compared to Chart 5, Central Area remains the most expensive area to afford to purchase an expensive home. However, Choa Chu Kang is the most affordable in terms of average price per sq meter value.
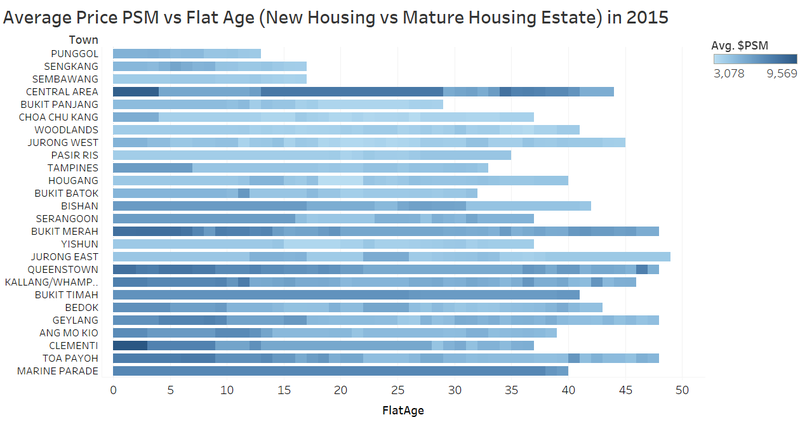
Chart 7 shows distribution of newer housing estate vs mature housing estate in terms of the age of resale flats. Punggol and SengKang are two estates with average Flat age of about 12 years.
3) What type of resale HDB house to buy?
After examine at the affordability vs location, next questions would be what type of flats to purchase. Chart 7 to ?? provides the insights about housing attribute to consider for different kind of resale house in Singapore housing market.
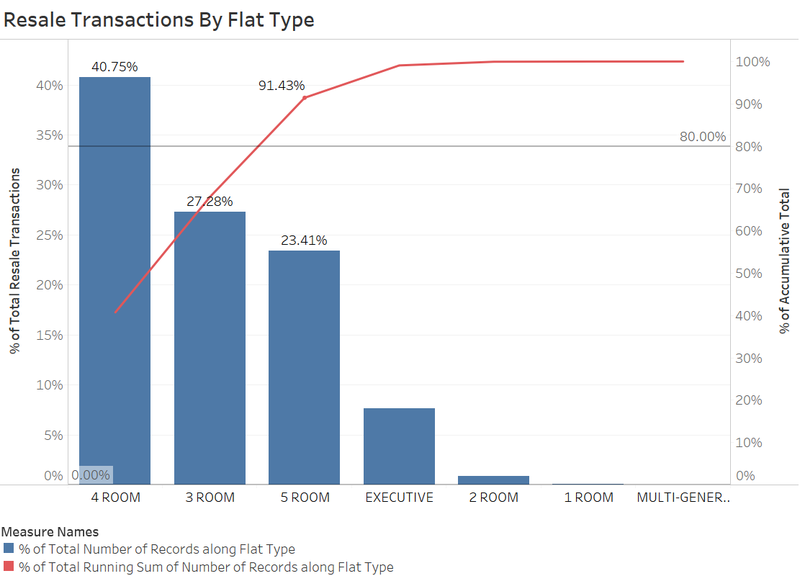
From the Pareto Chart, we can know that resale public houses with 4 ROOMs (40.75%) are most popular and common in the market, following by houses with 3 ROOMs (27.28%) and 5 ROOMs (23.41%), respectively. In addition, by looking at the cumulative curve, we can draw the conclusion that resale house with 3, 4 and 5 ROOMs take account for large proportion in the supply share, which add up to 91.43%. On the contrary it is hard to find resale houses with 2 or 1 ROOMs and MULTI-GENERATION house in Singapore.
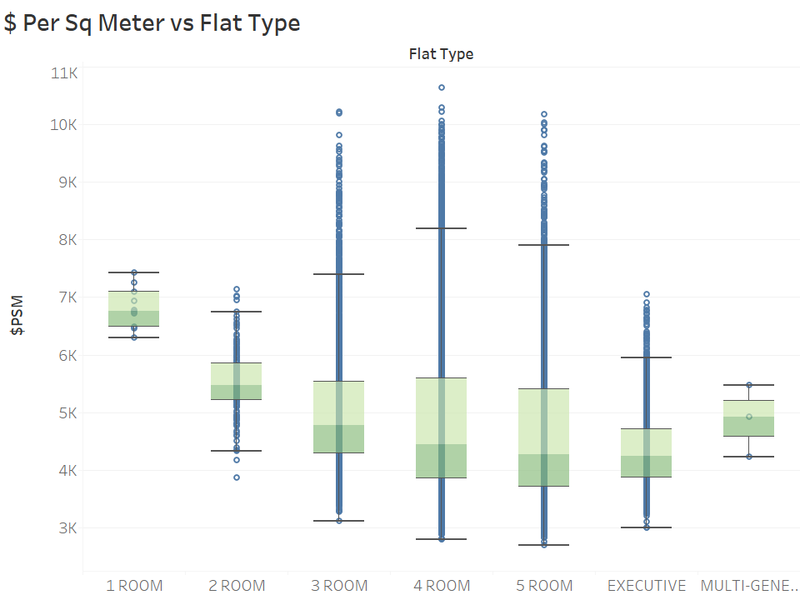
In Chart 9, it’s interestingly to find out that 4 room has almost the same median price PSM for as compared to 5 room / Executive Flats. That means if might be convincing if one should consider to buy bigger size unit for a worthier investment in terms of price SqM.
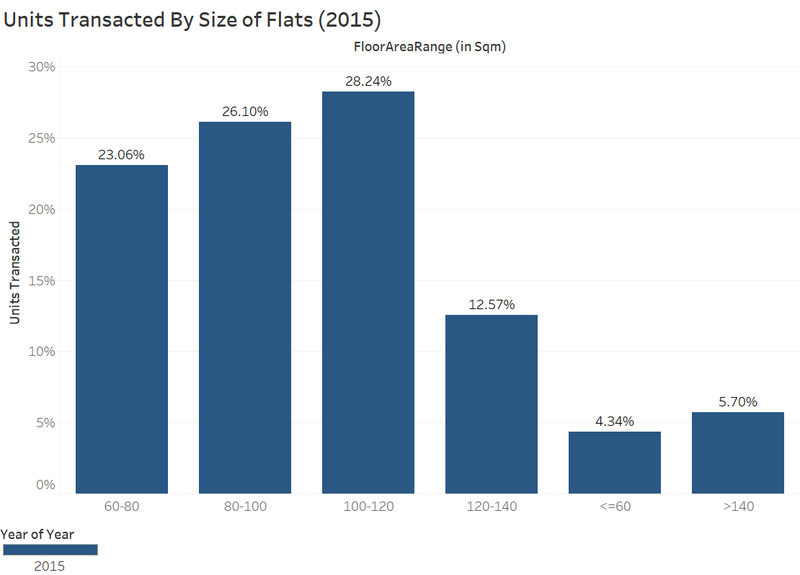
In Chart 10, it shows that the smaller size unit flat is more popular as compared to a bigger size unit. About 50% of resale transactions in 2015 are units with size less than 100 Sqm.
 </gallery>
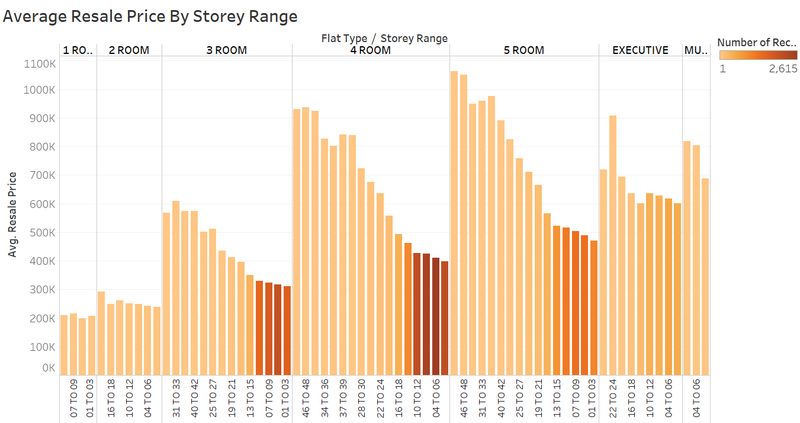
Finally, from most of the transacted flats, the buyers usually prefer middle Storey range from 07 to 12 for almost all types of flats, due to higher price for higher floors.
