ISSS608 2016-17 T1 Assign1 Franky Eddy
Contents
Abstract
Resale flat price
Problem and Motivation
For someone who wanted to buy or sell a flat, there are several things that they usually wanted to know. The following are the questions that are usually comes to their minds when considering to buy or sell a flat:
- What are the shares of the resale public housing supply in 2015?
- What are the distribution of the resale public housing prices in 2015?
- With reference to the findings, compare the patterns of the first-half of 2016 with the patterns of 2015.
Approaches
Getting the Data
The first thing to do is getting the data. The data is downloaded from data.gov.sg, the national data portal of Singapore. The data that will be used is Resale Flat Prices data from March 2012 onwards. https://data.gov.sg/dataset/resale-flat-prices
Data Preparation
After getting the data, the next step is exploring and preparing the data so that further analysis can be done.After exploring the data, it is known that the variable month is in text format instead of number. Therefore, a new formula is created to change the month from text to number. The formula for changing the month is DATE(LEFT([Month],4)+"-"+RIGHT([Month],2)+"-01")
Analysis
After exploring and preparing the data, analysis of the data can be done by using Tableau 10.0.
Tools Utilized
The only tool used is Tableau 10.0.
Results
There are 3 results:
Flat Model
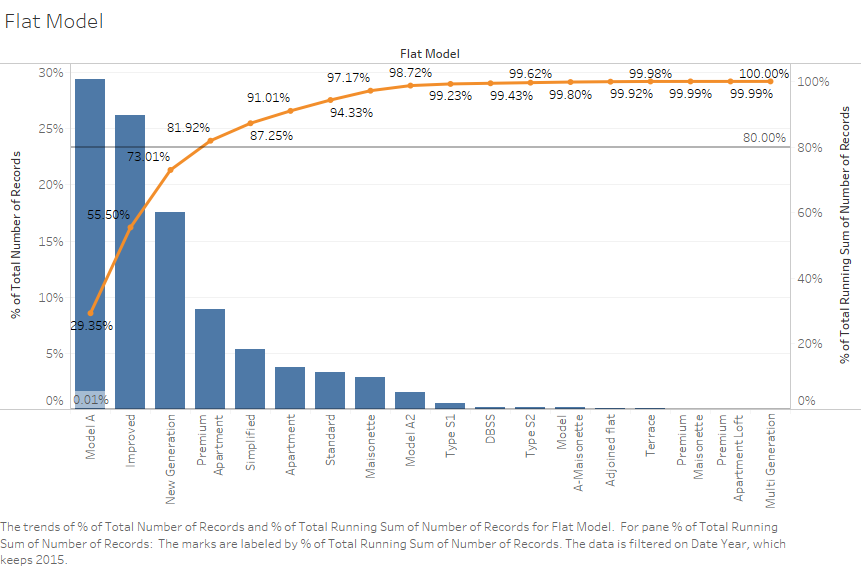
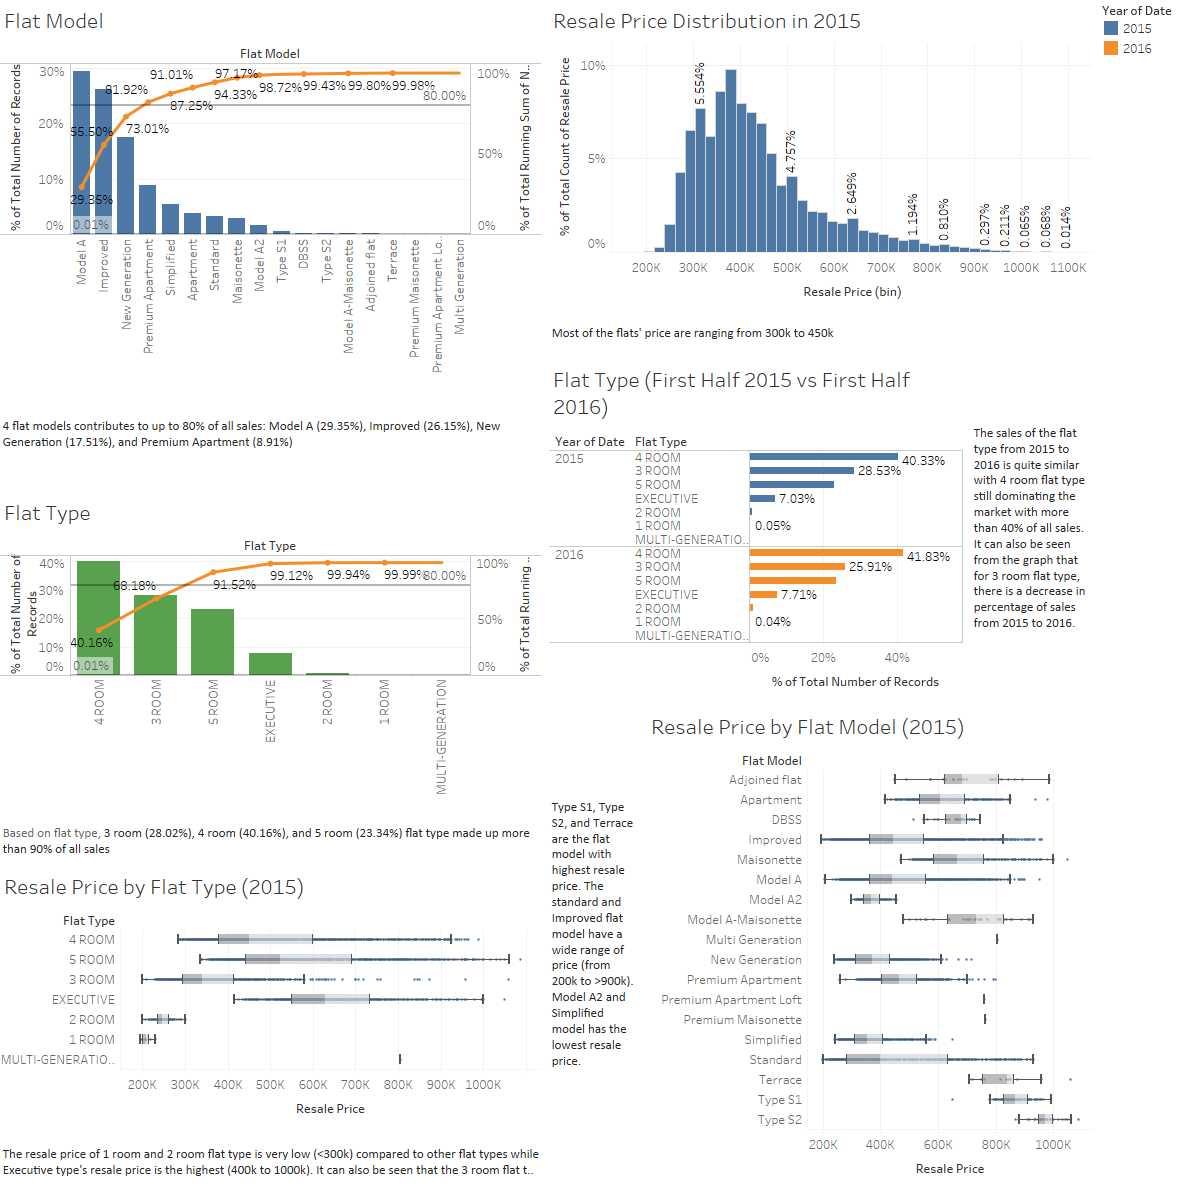
From the graph, it can be seen that out of 18 different flat models, there are 4 flat models that contributes to up to 80% of all sales. They are: Model A (29.35%), Improved (26.15%), New Generation (17.51%), and Premium Apartment (8.91%).
Flat Type
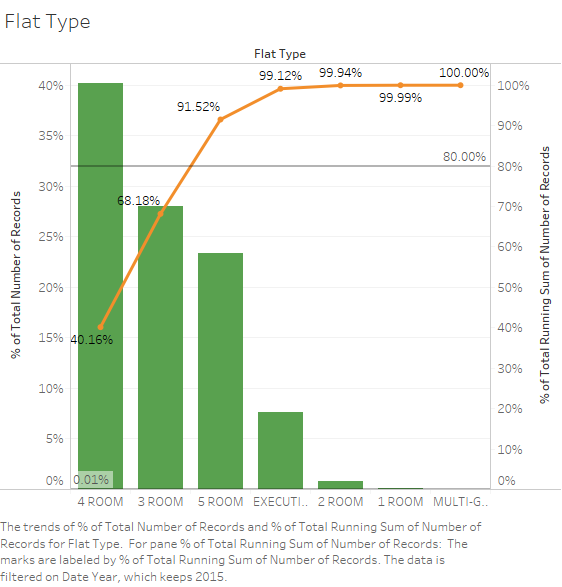
Based on the graph, it can be seen that 3 room (28.02%), 4 room (40.16%), and 5 room (23.34%) flat type made up more than 90% of all sales.
Distribution of Area
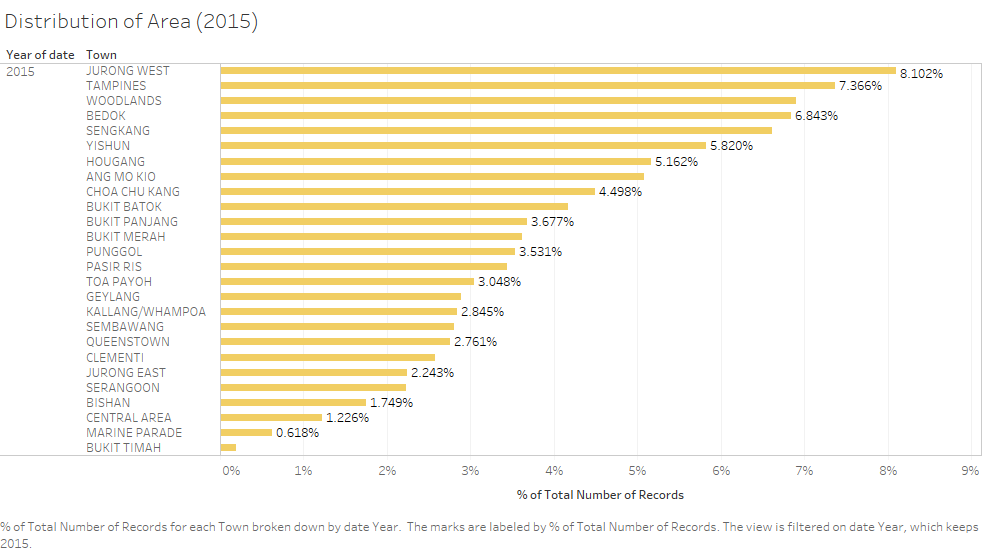
From the distribution of area, it is known that Jurong West (8.102%) and Tampines (7.366%) are the area with most sales while Bukit Timah is the lowest sales area with only less than 1% of all sales.
Distribution of The Resale Public Housing Prices in 2015
Resale Price Distribution in 2015
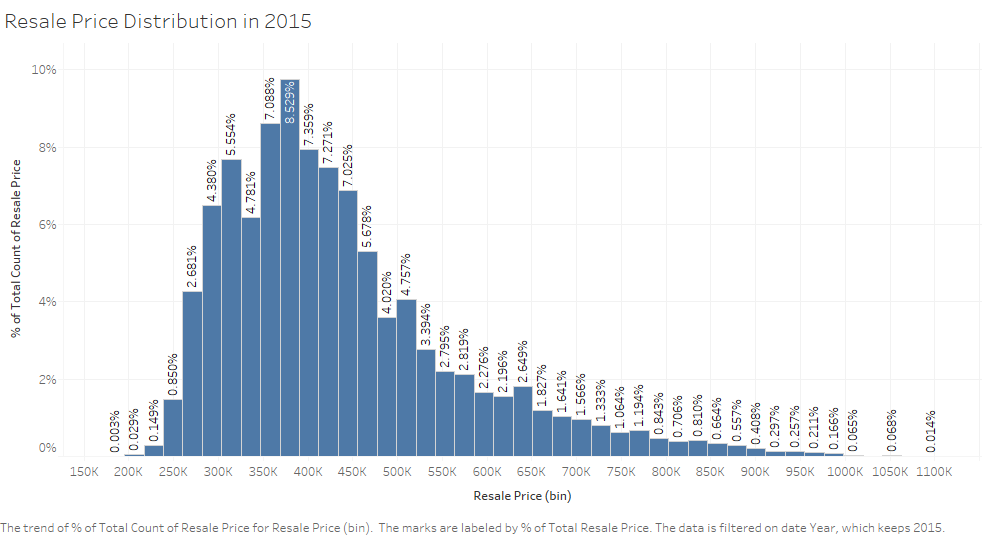
From the distribution of the resale price, it can be seen that most of the flats' price are ranging from 300k to 450k.
Resale Price by Flat Type in 2015
From this graph, it can be seen that the resale price of 1 room and 2 room flat type is very low (<300k) compared to other flat types while Executive type's resale price is the highest (400k to 1000k). It can also be seen that the 3 room flat type has widest range of price (from 200k to 1050k).
Resale Price by Flat Model in 2015
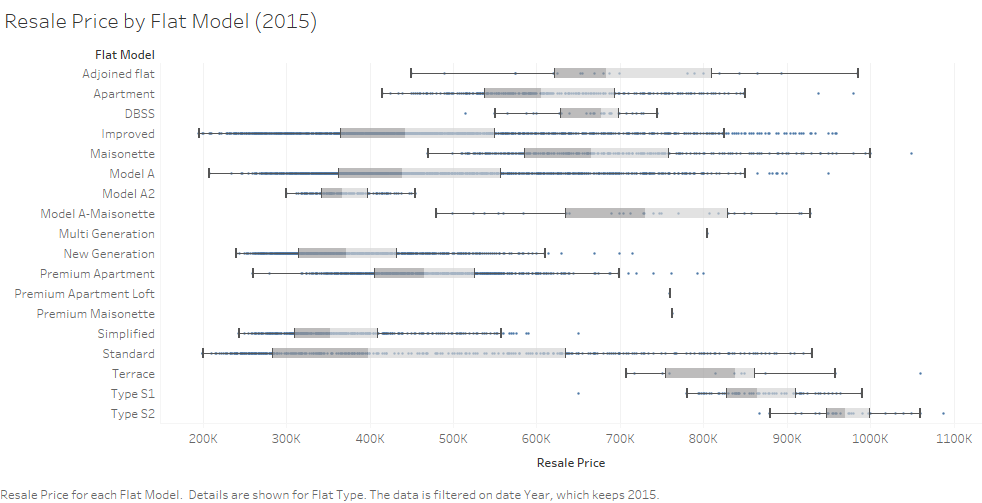
It can be seen from the graph that Type S1, Type S2, and Terrace are the flat model with highest resale price. The standard and Improved flat model have a wide range of price (from 200k to >900k). Model A2 and Simplified model has the lowest resale price.
Comparison of The Patterns of The First-Half of 2016 with The Patterns of 2015
Comparison of Flat Type
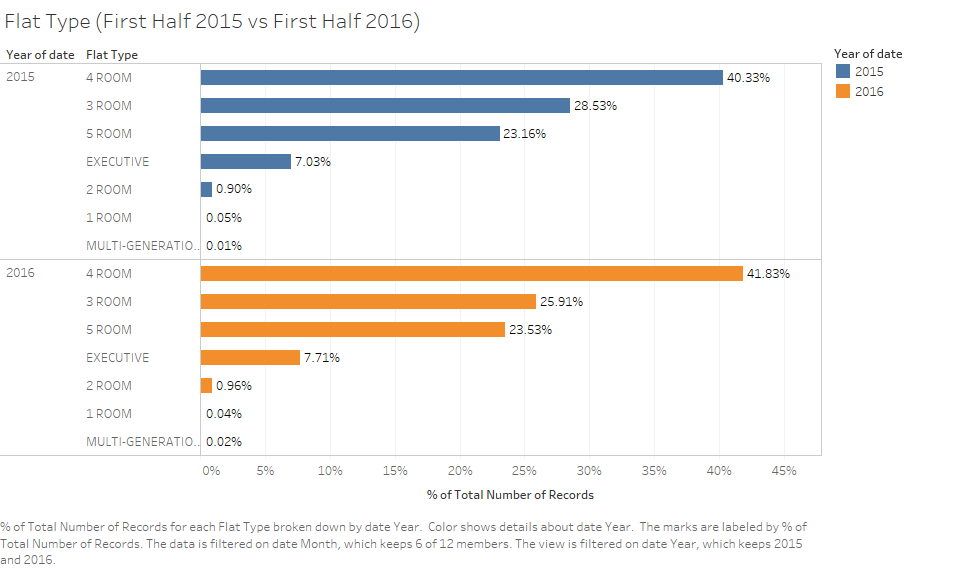
From this graph, it can be seen that the sales of the flat type from 2015 to 2016 is quite similar with 4 room flat type still dominating the market with more than 40% of all sales. It can also be seen from the graph that for 3 room flat type, there is a decrease in percentage of sales from 2015 to 2016.
Comparison of Flat Model
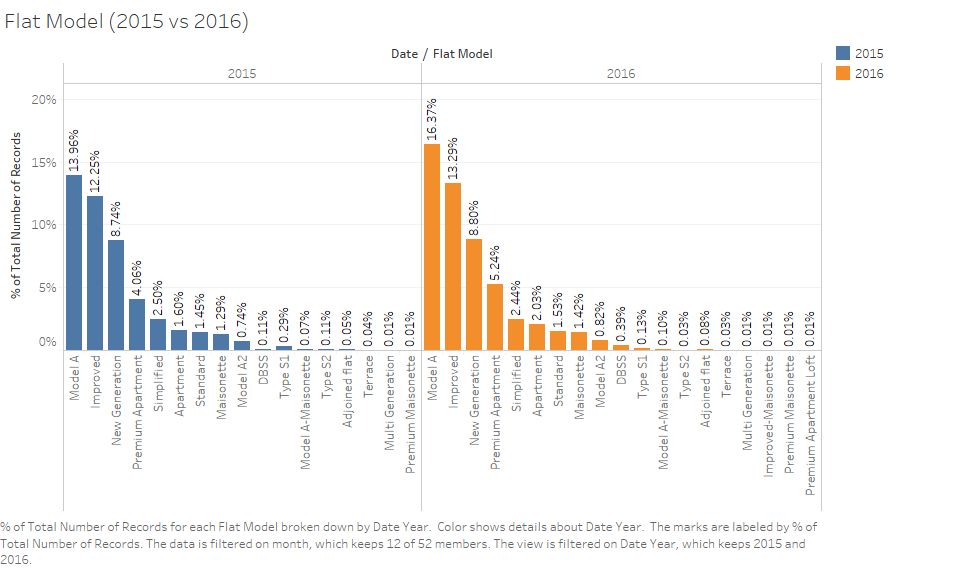
From the comparison graph, it can be seen that Model A has the most sales in 2015 and 2016. Model A even increases about 2.5% in terms of percentage of sales from 2015 to 2016.
