ISSS608 2016-17 T1 Assign1 Frandy Eddy
Contents
Abstract
Abstract
Problem and Motivation
Knowing sufficient information about resale flat prices, the trend, and the factors affecting the price is important for someone who wants to buy or sell a flat. Some of the key points that need to be answered includes the following:
- What are the shares of the resale public housing supply in 2015?
- What are the distribution of the resale public housing prices in 2015?
- Compare the patterns of the first-half of 2016 with the patterns of 2015
Approaches
Data Preparation
The data can be obtained from https://data.gov.sg/dataset/resale-flat-prices. As we are more interested to analyze the resale flat price in 2015 and 2016, we will use the dataset from March 2012 onwards. After connecting the data to Tableau, we need to create a calculated field to transform the "Month" from text to date format. This can be done by using DATE(LEFT([Month],4)+"-"+RIGHT([Month],2)+"-01").
Data Analysis
The analysis done are mainly focused on comparing the patterns of 2015 with the patterns of the first-half of 2016.
Tools Utilized
Tableau is used for data preparation and analysis
Results
Text
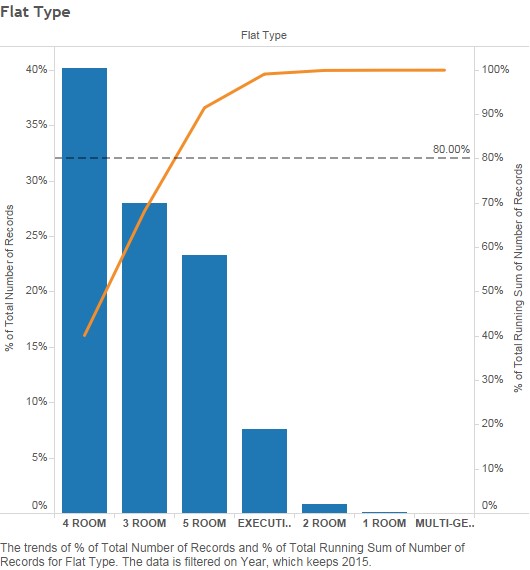
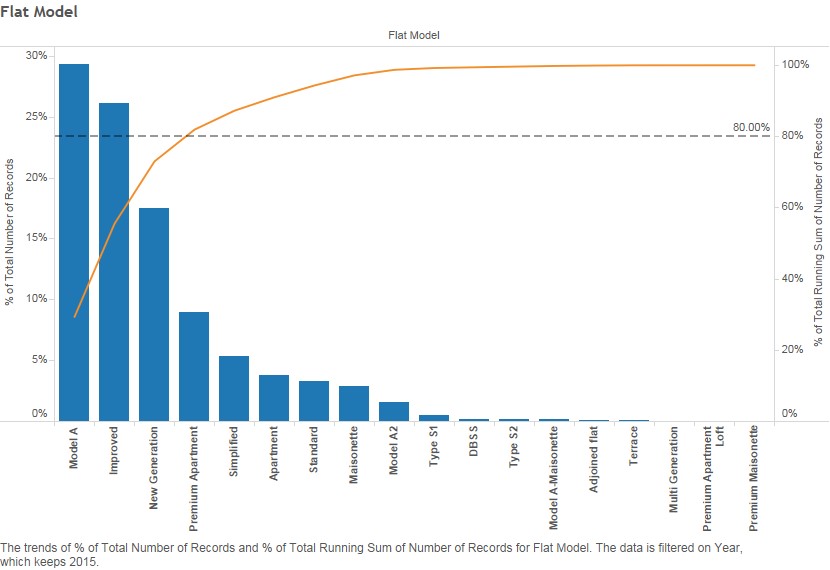
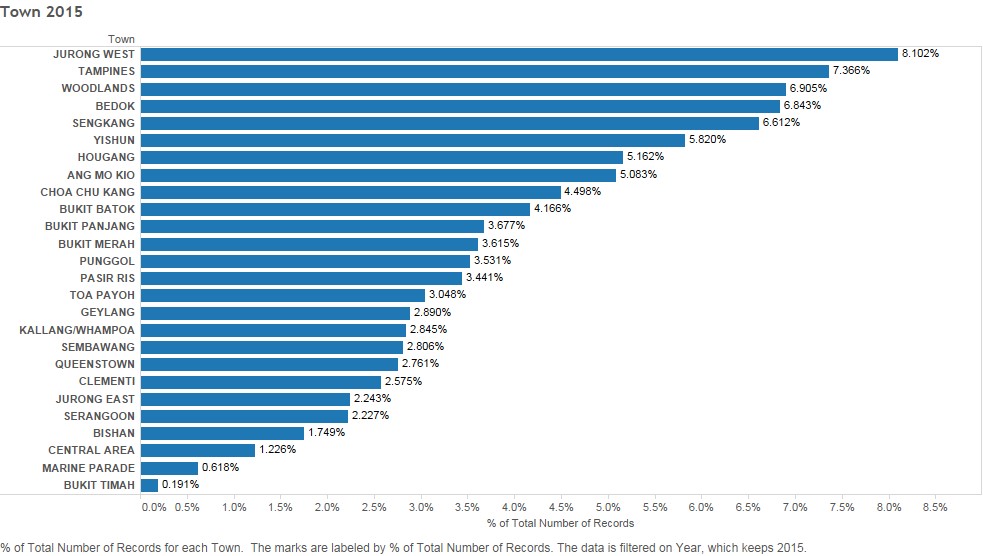
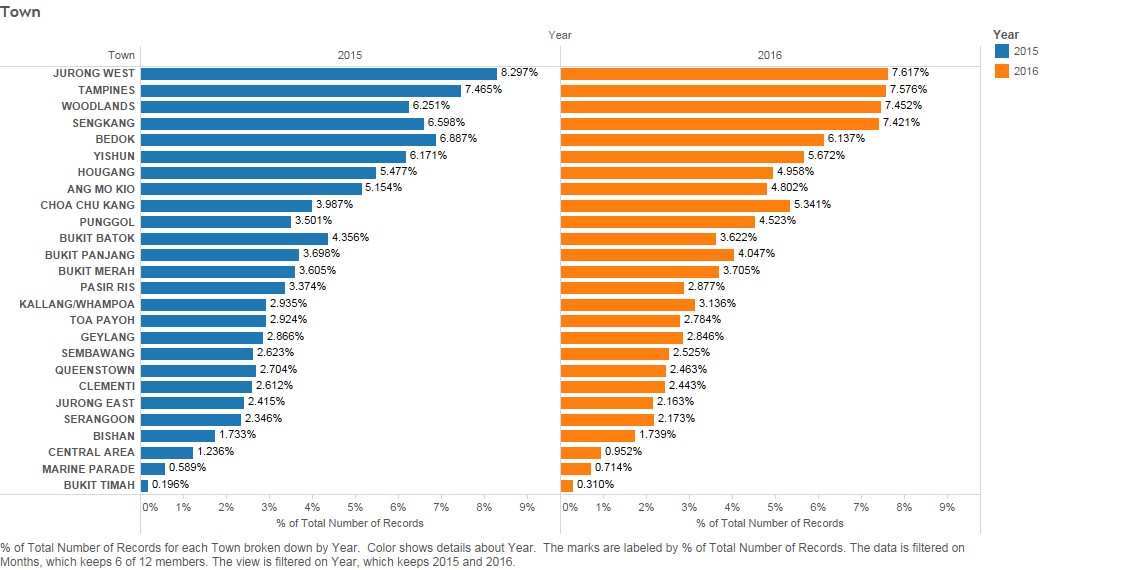
The share of resale public housing supply in 2015 can be observed by flat type, flat model, or town.
By Flat Type
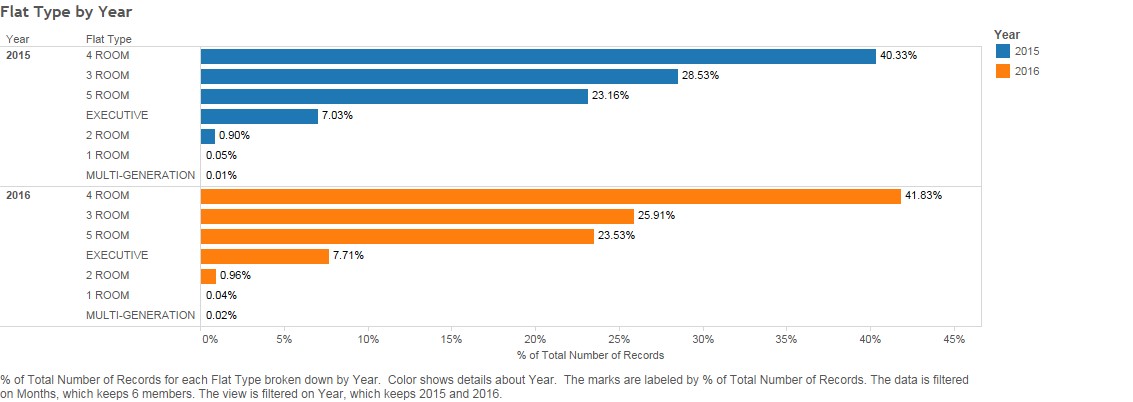
The sales in 2015 are dominated by 3-room, 4-room, and 5-room flat type.
By Flat Model
Out of all 18 flat models sales, more than 80% are from 4 flat models (Model A, Improved, New Generation, Premium Apartment)
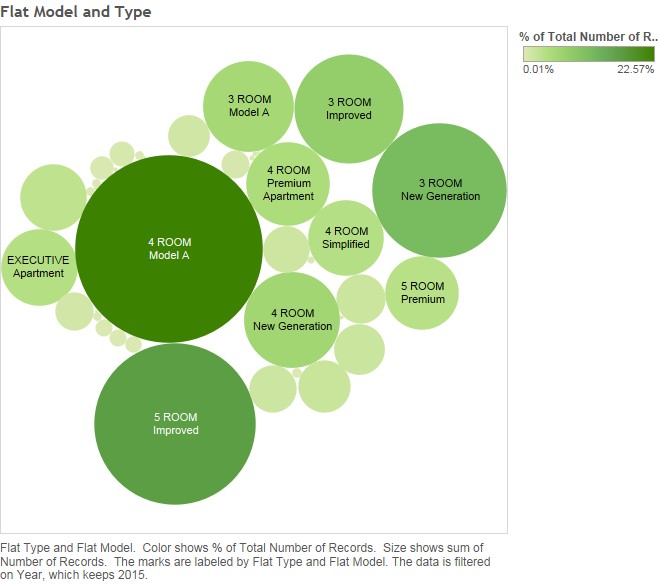
By Flat Model and Type
4-room Model A, 5-room Improved, and 3-room New Generation are the combinations of flat type and flat model with the most number of sales in 2015.
By Town
Text
Distribution of Resale Public Housing Prices in 2015
Price Distribution
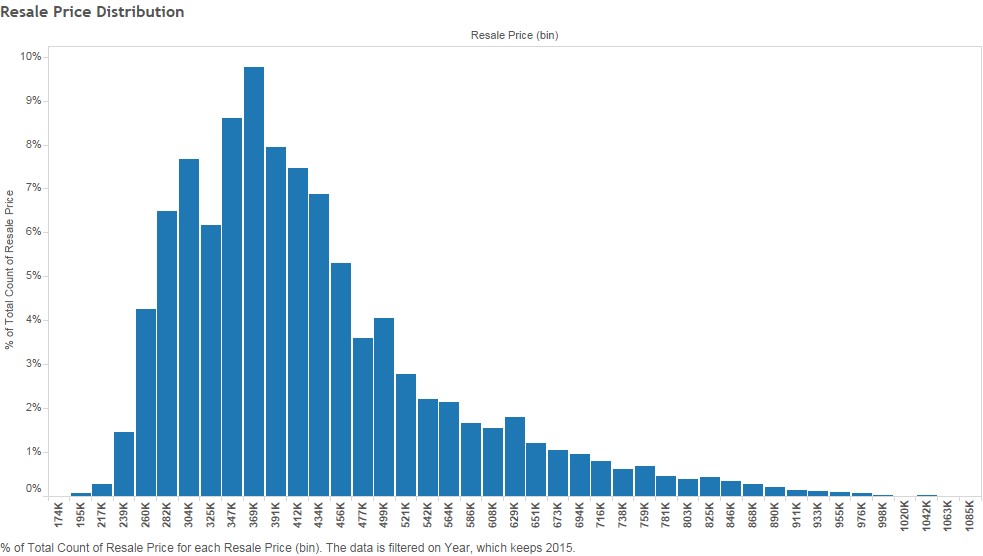
The distribution of price of resale public housing in 2015 is right-skewed with most observations (~25%) ranging between 350K and 400K. The lowest price is 195K and the highest price is 1088K
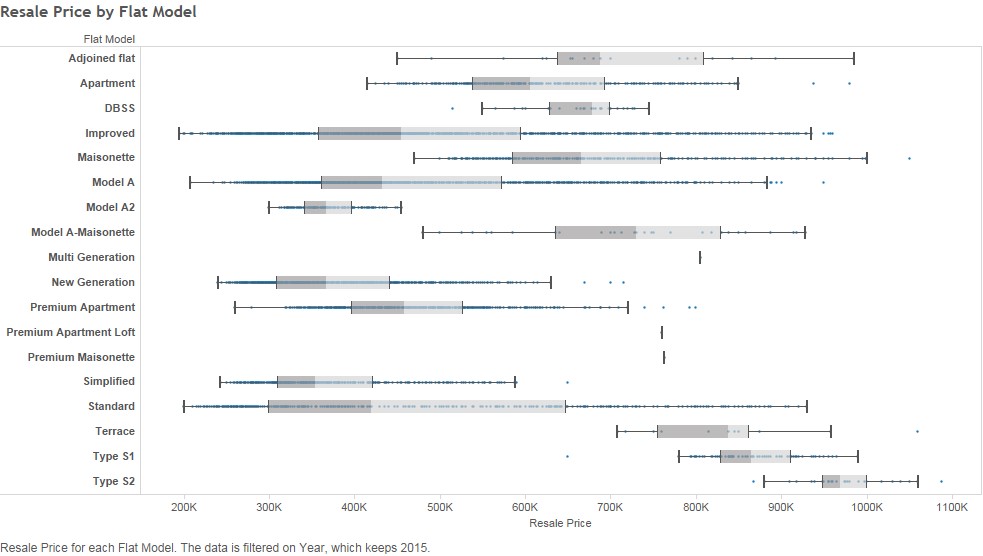
By Flat Model
Text
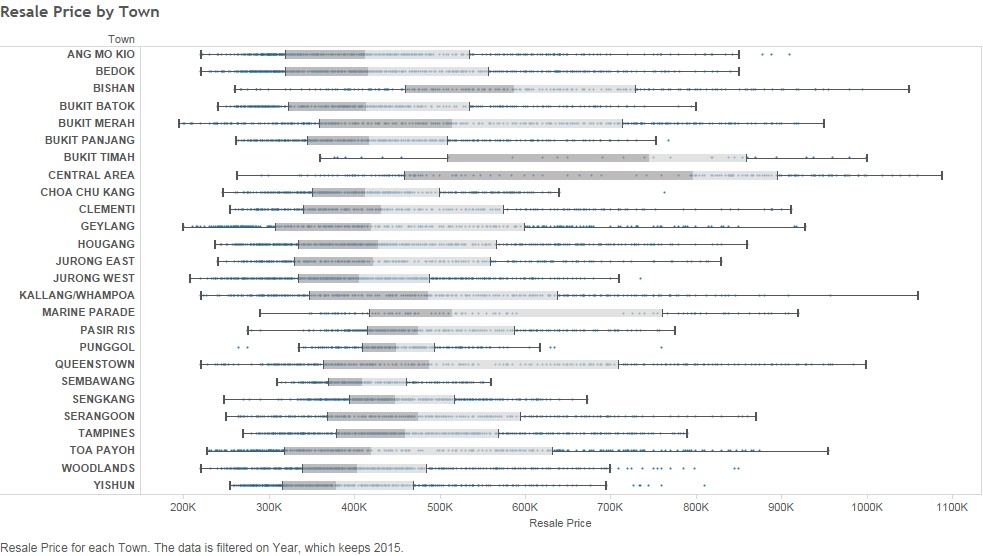
By Town
Text
First Half of 2016 vs 2015
Text
By Flat Type
Text
By Town
Text
