ISSS608 2016-17 T1 Assign1 CHRIS THNG REN JING
Contents
Abstract
Problem and Motivation
Based on the conclusions drawn from the previous analysis of the (1) shares of re-sale public housing supply and (2) distribution of re-sale public housing prices. A single conclusion can be drawn; 4-room flats are the most supplied as well as demanded type of public housing in Singapore.
After conducting research with supporting statistics from both Singstat and Data.gov, it was found out that the majority size of a typical household was 4. The statistics shown below, explained why 4-room flats were in large demand and supply by Singaporeans. It is an average Singaporean family’s property needs.
With the analysis done on the resale supply and prices in 2015, single conclusion derived (4-room flats popularity) and supporting statistics from Data.gov and Singstat.gov
affirming the conclusion, this provides us with the necessary information to further analyze the resale trends for a typical household.
Presently, Singaporean families cannot decide which property to buy, there are just too many variables to think about: Location, Price, Size and etc.
However, based on the above findings, this analysis shall address the majority of Singaporean families (those with a household size of 4) flat purchasing problems. The purpose of this analysis is to determine the most cost-effective 4-room flat for the average Singaporean Household. This will save the buyer time, money and most importantly put a roof over his family's head.
Approaches
What is the best 4-room flat an average family can get at the least cost?
Does the time period matter when purchasing a 4-room flat?
To answer the following questions, the analysis conducted will focus on the the trends seen from 2015 to 2016-Q2 and answer the following questions:
Could the timing of your purchase get you the best price?
If so, which quarter should you purchase your property in?
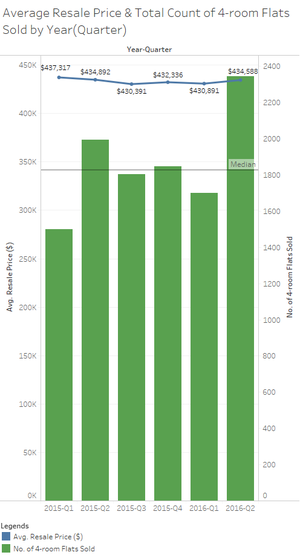
In the analysis below, the graph illustrates the average resale price of a 4-room flat against the different quarters to determine which quarter had the lowest average price. It also includes the number of 4-room flats sold in the different quarters to illustrate the number of choices the buyer would have.
From the graph shown, it can be seen that 2015-Q3 has the lowest average price per 4-room flat sold. In 2015-Q3 it neither has the least nor largest number of 4-room flats sold; it is in the median (as illustrated).
Conclusion we can draw:
- Q3 provides the lowest price
- Q3 provides a good supply (it is at median line) of 4-room flats to choose from
This pattern can be seen from 2015, however 2016 may draw a different conclusion as 2016-Q3 results have not been published. However, if this pattern proves to be true in 2016-Q3 as seen in 2015, it would be recommended for buyers to look for 4-room flats to purchase during Q3.
Does the location of your property matter when purchasing a 4-room flat?
To remain consistent, the same time period of 2015 to 2016-Q2 will be used to conduct this analysis and answer the following questions:
Which location can you get the best price from?
>>Metric used: Average Cost ($)/Floor Area Square Metre
In order to go about answering this question, the data used had to be reorganized as shown below and a new calculated field, Average Cost ($)/Floor Area Square Metre had to be created. This uses a simple formula together with the respective filters for the Year-Quarter (2015 to 2016) and Flat Type (4-Room). This metric is key to begin this analysis.
Based on our previous analysis: Does the time period matter when purchasing a 4-room flat?
I found out that:
- Q3 provides the lowest price
- Q3 provides a good supply (it is at median line) of 4-room flats to choose from
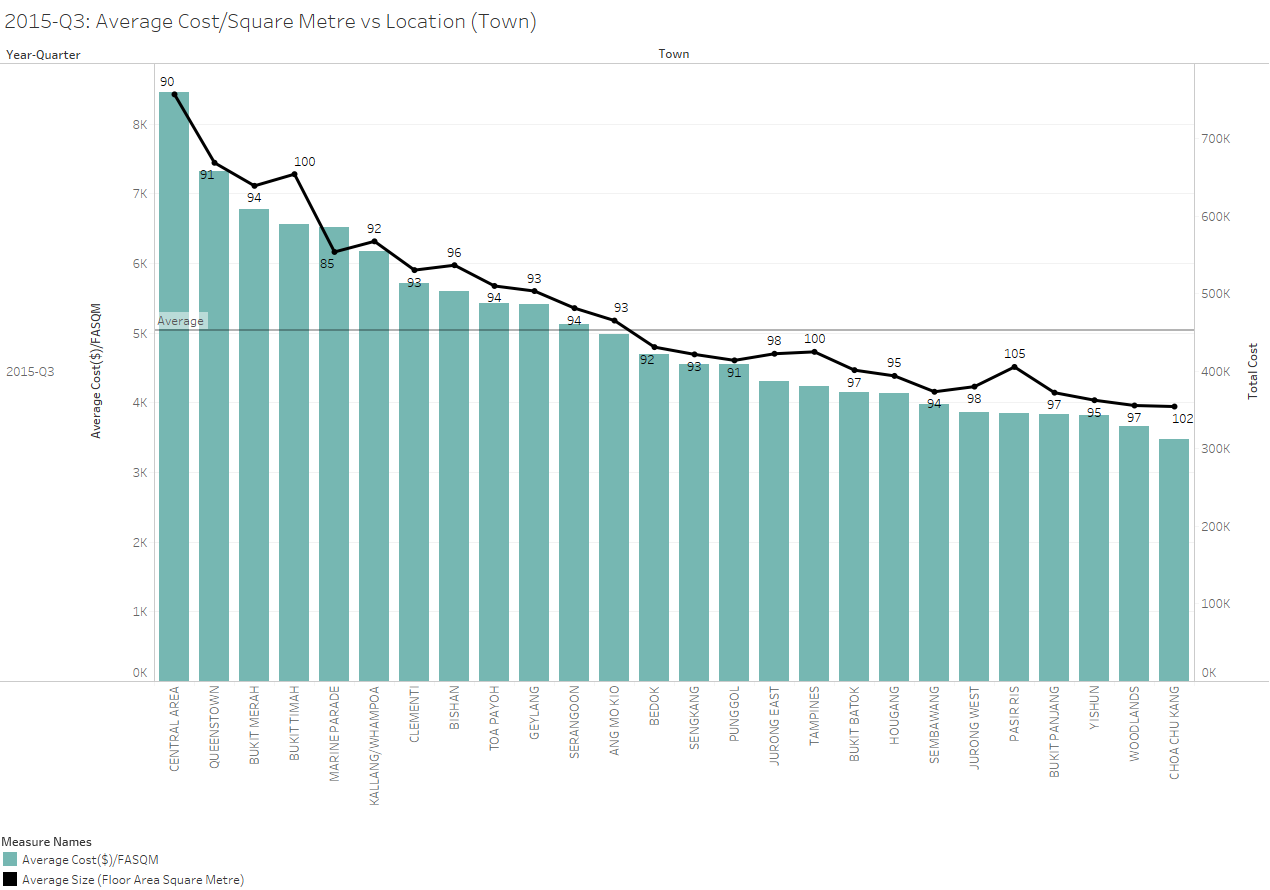
Hence, the focus will be on 2015-Q3. In this graph, its primary focus is to show the average cost ($) per square metre per location. The secondary purpose is to show the average size of a typical 4-room flat per location. The average square metre per location is marked and labelled in black. Using this, we will focus below the reference line (average) of the average cost per square metre in order to narrow the scope towards the most cost-effective flats per location. From this, the most cost-effective and largest sized flats can be identified easily.
It can be seen that the biggest flats (>100 area square metres) are:
- Pasir Ris (105.4 sqm)
- Choa Chu Kang (102.1 sqm)
- Tampines (100.3 sqm)
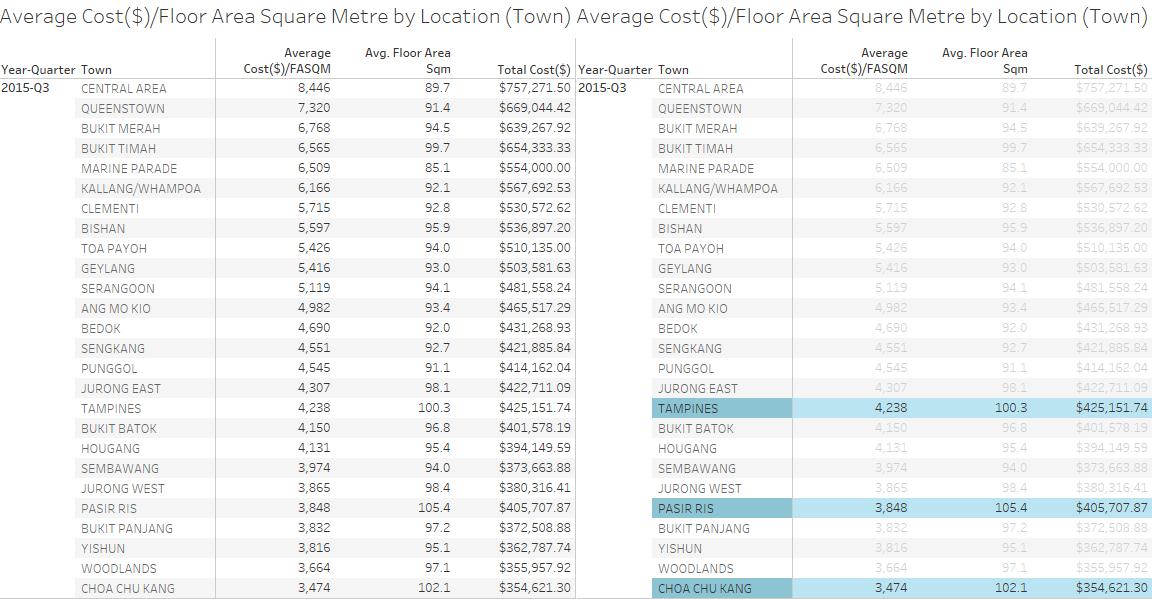
The data in the table below supports these findings and provides the cost of the respective flats per location for reference.

By generating the tables below, buyers can reference against the average cost per square metre, average size and average cost to make their own judgement. The table below is sorted in ascending based on the average cost per square metre, it includes the average floor area square metre and the total cost. This allows potential buyer to identify the most cost-effective flat (by average cost per square metre), the flat size they want (average floor area square metre), and the total amount that would be required to invest in the flat.

Finalizing the options(3)
Comparison amongst the three biggest 4-room flats:
- Choa Chu Kang has the lowest average cost per square metre and the flat size is an average of 102.1 square metres; the median size of the chosen three locations.
- Pasir Ris has next lowest average cost per square metre and the flat size is an average of 105.4 square metres; the largest size of the chosen three locations and also amongst all the locations.
- Tampines has the highest average cost per square metre and the flat size is average of 100.3 square metres; the smallest size amongst the chosen three locations.
Verdict
Cheapest 4-room flat:
Choa Chu Kang
Cost: $354,621
Size: 102.1 Square Metres (second largest average size amongst all locations)
Largest 4-room flat:
Pasir Ris
Cost: $405,707 (lowest possible price using average cost per square metre metric)
Size: 105.4 Square Metres
Tampines, although the third largest flat, does not give you the best average cost per square metre. Hence, will be excluded as it meets neither of the two criteria in picking the most cost-effective flat:
- Largest size
- Lowest cost
In conclusion, should you continue seeing the trend of 4-room flat prices being at its lowest price and having the median number of flats in 2016-Q3, combined with this analysis on the most cost-effective flat, potential buyers can use the analysis as a good reference point in buying the most worth it 4-room flat.
Results
Tools Utilized
- Tableau
- Excel Data
- Paint
- Wikipedia
Limitations
Tableau
Although it has gone through many upgrades and has a great user interface, many basic functions such as highlighting, labeling, scale-sizing and etc. are too complex, it requires the user to go through a filter parameter/calculated field/rule-based function in order to conduct such a basic function. I would prefer if it were to be similar to excel, which allows the user to either use conditional formatting or manual formatting, this creates flexibility. Other than that, it is a great software to analyze data!
Data
The data derived from Data.gov.sg is limited and more often that not varies in terms of format (year to year basis). This hinders analysis and requires the user to search for other sources to piece together a clear picture of the data set.
The data used, 2015-2016, is very limited in terms of identifying trends and may not that be that reliable considering it is only a span of 1 year as compared to data spanning a range of 10 years.
General observations
For Supply:
- Most of the transactions are located in the new towns which are far away from CBD and like JuRong West, Tampines and Woodlands
- On the other hand, the less traded regions (top 3) are Bukit Timah, Marine Parade and Central Area, which are all located in the centre of the country.
- Within one region, the most traded flat type is normally “4 ROOM” for high transacted regions and “3 Room” for the less transacted regions.“1 ROOM” and “MULTI-GENERATION” are so few traded that we can hardly recognize them in the chart above.And “2 ROOM” are also traded much less than the other types.
- The Supply Volume experienced a big drop in 2013 and rebounded in 2015.
- Volume Distribution in terms of flat types is very stable, and the volume ranking never change.
- The most traded type is “4 ROOM”, followed by “3 ROOM” and “5 ROOM” when talking about the total supply of each year.
- The transaction pattern of the major types of flat don’t have big change, they are all fluctuating slightly.
- For the most transacted type—“4 ROOM”, its portion of total is on an uptrend. On the opposite, the second transacted type—“3 ROOM” is experiencing a slight drop starting from 2014.
- The fluctuation shows that the supply has time series pattern. Normally there is a peak in October, and around April and May. And there is no apparent difference in terms of different flat types.
For Price:
- The Trading price per m2 largely following a normal distribution with a fat right tail. The average price of 2015 is S$4817/m2, which is right biased due to the fat right tail.
- What we can find is, the resale prices are affected by the human preference—the most traded prices are multiples of 100, especially those which are multiples of 500.
- The Price Distribution Patterns of 2015 and 20161H are very similar.
- As we can see, the more the ROOMs of a flat, the less expensive the average price which is consistent with economies of scale—more ROOMs mean bigger floor area, and that will make the building cost and other costs that are allocated to per m2 cheaper.
- The most transacted top 3 types of the market are respectively “4 ROOM”5 “3 ROOM” and “5 ROOM”, but their prices ranking (low to high) is not consistent with the transaction volume ranking, which means the economical one is not always the most traded. And that means other factors like people’s usage needs and market supply pattern are also affecting people’s property preference, which is very reasonable in real-life property transaction.
- The town price ranking is relatively stable, and the prices for the central areas are more expensive than those new remote areas, which are consistent with our common sense.
- As you can see, starting from 2015, for those expensive areas (especially Central Area), the price per m2 actually goes even higher, and for those economical areas, the price per m2 is going lower. To sum up, the high higher, the low lower. The high increased more obviously than the low drop.
- For 2012 to 2016 1H, the central area’s price changes much more dramatically than other areas, experiencing a big jump in 2015 and dropped back slightly in the first half of 2016.
- The transaction prices are dropping during the years.
- The average prices of each type are very stable during the years when compared with the average prices of the respective years.


