ISSS608 2016-17 T1 Assign1 Aditya Hariharan
Abstract
Data has an important story to tell. They rely on us to give them a clear and convincing voice. The data used in the ensuing report has been taken from the government of Singapore’s open data portal ‘data.gov.sg’ to answer certain essential questions related to the supply and prices of housing units in Singapore’s resale public housing market.
In this assignment I will be exploring various trends in Singapore’s resale public housing supply and price distribution across the various towns and residential areas within Singapore. The main variables I will be considering are:
1. The number of resale applications in Singapore
2. Each Flat type and their sum total and average number of applications
3. The price of the Housing Units across the geography of Singapore.
Problem and Motivation
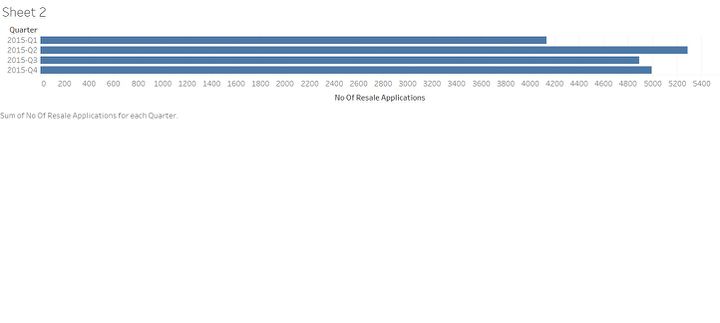
From the data extracted from the open portal, it is clear that there is a clear dilution of supply in housing units for quarter-1 of 2015 which immediately spikes up in Quarter 2 and reduces slightly from there in the next 2 Quarters. The supply is maximum in Quarter 2 which could be inferred as a drop in demand for the housing for the same quarter.
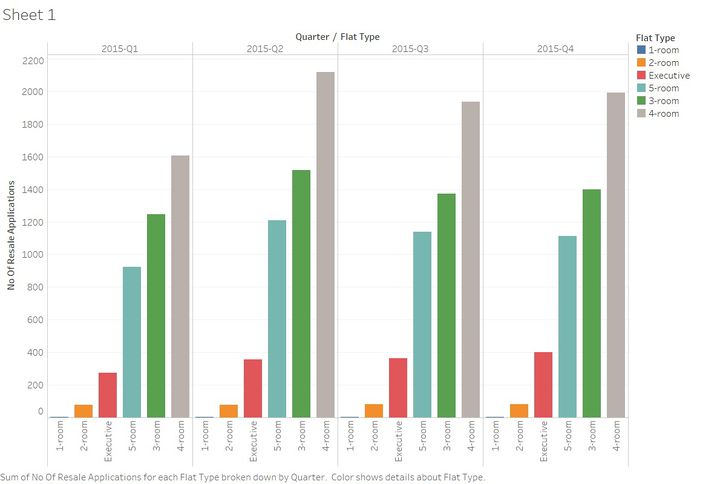
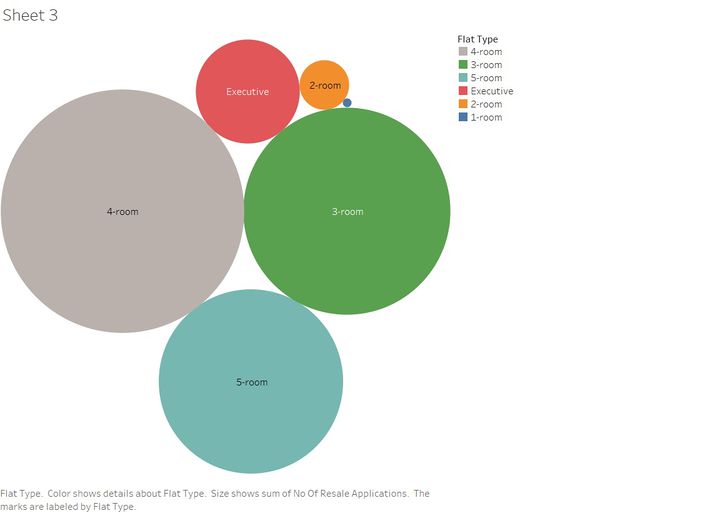
When we split the graph into the various flat types we see an interesting trend in that 4 bedroom houses have the highest supply in the market for every quarter. There could be many possible inferences to be drawn from this including the fact that Singaporean families are becoming increasingly nuclear and hence preferring smaller places to live in. The flat types maintain their supply ranking across each of the quarters with 1 bedroom houses being the hardest to find.
Coming to the price indexes for each of the towns in Singapore. The highest priced town is Bukit Timah and central area by far


