ISSS608 2016-17 T1 Assign1 WESLEY CHAN
ISSS608 2016-17 T1 Assign1 Wesley Chan
Contents
Abstract
Having worked and lived here in Singapore for a few years, my friends and colleagues would always advise me to buy a property here, instead of renting one, as it was in their words a “sure-win” investment, due to growing demand from both Singapore residents and overseas investors, as well as limited land supply in Singapore.
Problem and motivation
Buying a property in Singapore is probably one of the biggest financial decisions that I would make in life, given the high costs of properties in Singapore.
The Housing Development Board (“HDB”) resale market has been in the doldrums for a few years now following the introduction of property cooling measures by the Singapore government viz. the Additional Buyer’s Stamp Duty (“ABSD”) and Total Debt Servicing Ratio (“TDSR”). Public housing prices have, however, showed signs of stabilising lately, with some property analysts calling that prices may have bottomed out in the third quarter of 2015 .
The burning question thus pops up: Is it time to buy now? How do I go about choosing a property? What are the factors that affect property prices in Singapore? It is perhaps opportune, to start monitoring now, with the use of visual analytics.

Tools Used
Microsoft Excel 2013 – for quick data manipulation
Tableau 10.0 – for visualisation and info graphic
Approaches
Although there are lots of press articles and websites like SRX.com.sg (http://www.srx.com.sg/singapore-property-news) for reading on the Singapore property market, you never really get the full picture. Accordingly, I decided to do my own research and found a data set on the HDB resale market on Data.gov.sg, the national data portal of Singapore.
The data set contains public housing resale transacted prices for the period from March 1, 2012 to June 30, 2016, based on the date of registration for the resale transactions. As data prior to March 2012 is compiled on a different basis (i.e. based on the date of approval for the resale transactions), I decided to ignore those data.

- Data collection and cleaning:
The initial data set required some data cleaning and preparations before importing as an Excel file to Tableau:
1. Introduce a new calculated field, “Unit Price (S$ psm)” for a more meaningful comparison across various flat sizes. Using the raw absolute “Resale Price” figure may be misleading for analysis. The Unit Price (S$ psm) is calculated as follows: [Resale Price]/[Floor Area Sqm].
2. Introduce a new calculated field, “Age of Flat / Lease Used” (measured in years) to estimate the age of the resale flat at the time of sale. The “Age of Flat / Lease Used” is calculated as follows: Year([Month]) - [Lease Commence Date].
3. Introduce a new dimension “Planning Area / Zone” to group the 26 towns into Urban Redevelopment Authority (“URA”) planning area, namely Central, West, North, North-East and East regions. This is to facilitate analysis later on.
4. Introduce a new dimension “Country” and “Postal Code” for each of the 26 towns in order to leverage the Map feature released in the new version of Tableau 10.0.
There were no missing data pattern detected.
- Choice for Chart Design:
For this assignment, I have followed the following chart design guidelines:
1. Use of time series chart and bar chart (as per above) to show the trends e.g. trend in HDB resale transaction volume and unit price since March 2012.
2. Use of the map function to better visualize the various towns on the Singapore map and their relative distance from the Central Business District (“CBD”). Bubble charts were layered on top of the Singapore map / town to show the relative transaction volume and/or median price at those locations. Their varied size provides a quick way to understand relative data.
3. Added colour to the five planning zone for more impact and ease of story-telling across the various charts.
4. Use of bar chart or stacked chart to show the highest and lowest value.
5. Use of histogram to show the distribution of transaction volume and unit price across various dimensions.
6. Use of boxplots to show the distribution of data to identify any outliers and/or skewness in the distribution and quickly compare distributions between data sets.
7. Use of scatter plot to investigate the relationship between “Unit Price” and “Age of Flat”. Scatter plots provide an effective way to see trends, clusters as well as any outliers.
8. Use of side-by-side bars and/or charts for comparing the patterns of the first half of 2016 with the patterns of 2015. Use of local filters to select only resale transactions registered in 2015 and 2016.
9. Avoid use of pie charts given the need for comparisons across various dimensions.
Resale Public Housing Transaction in 2015
For the first visualization, I decided to start using the map chart combined with the bubble chart to get a rough understanding of where the resale transactions were taking place. The size of the bubble provides a quick way to understand the relative number of units transacted at each town. I further grouped the 26 towns into 5 “planning zone” for ease of analysis and discussion.

There were 17,785 sales recorded in 2015, with the West and North East region accounting for almost half of all sales in 2015. Jurong West saw the highest volume of HDBs changing hands at 1,441 units (or 8.1% of the total 2015 sales), while Butik Timah hardly recorded any sale with only 34 units (or 0.2%) changing hands.
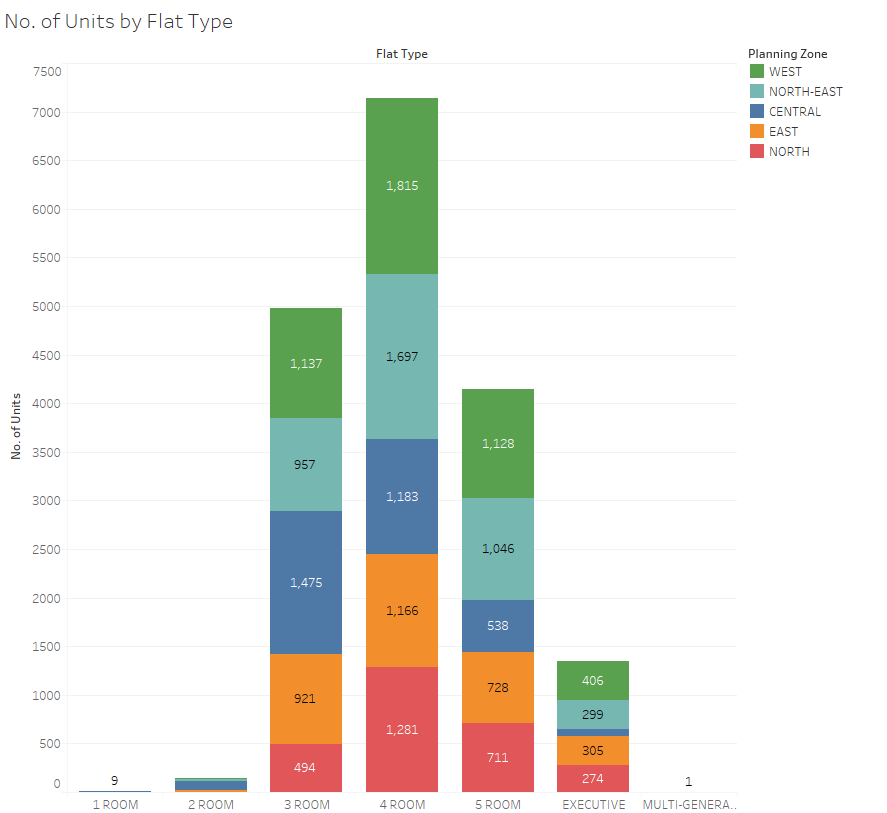
The next thing I looked at was the distribution of the resale transactions by flat type. By and large, most of the resale transactions were taking place in the 3 to 5-room flats. This observation was consistent across all the 5 planning zones. Going forward, I decided to exclude the 1-room and Multi-Generation flat in my analysis as it may not be meaningful for comparison with just 10 resale transactions.
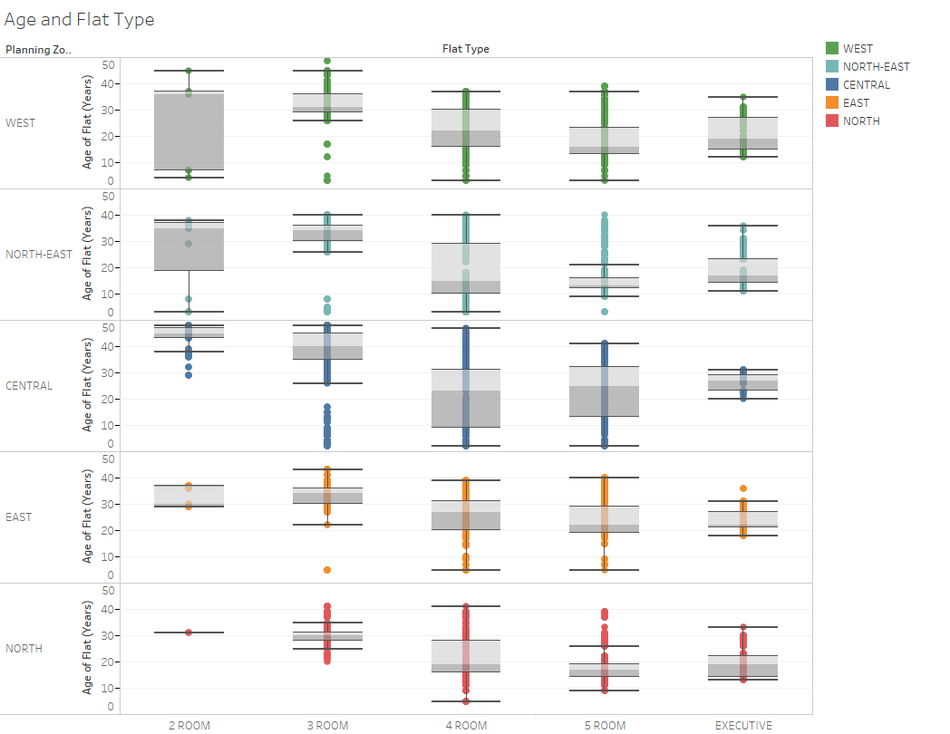
An interesting observation came up when analyzing the resale transaction by flat type and age. The 2 and 3-room flats sold were relatively much older flats, at around 40 years old (or c. 60 years left in lease tenure) compared to the 4-room, 5-room and Executive flats.
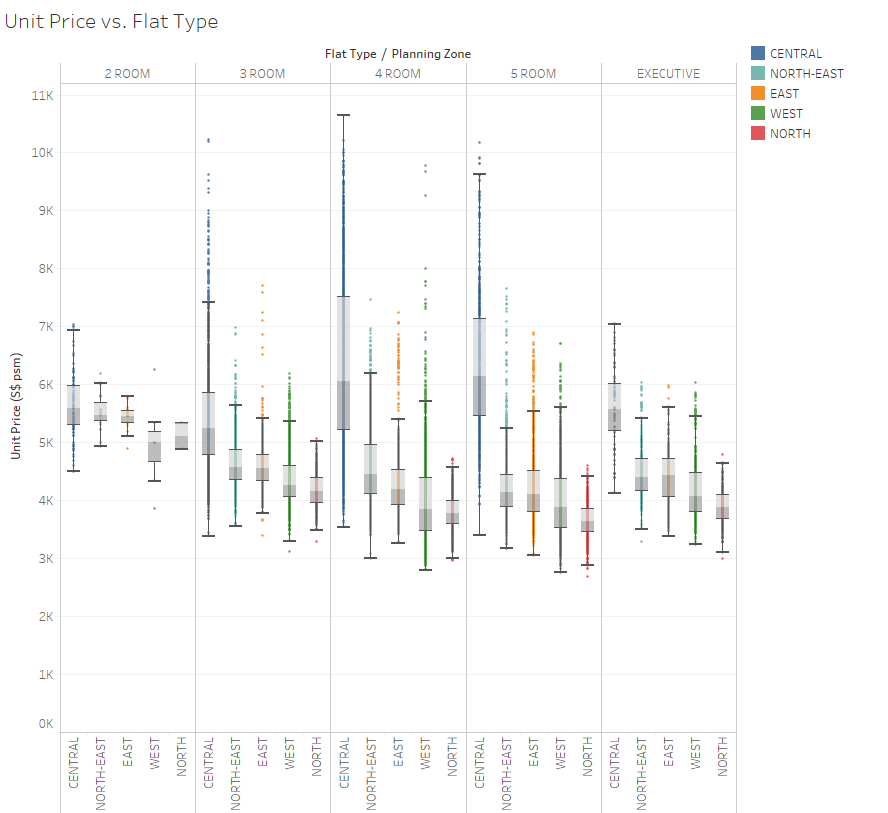
Next I looked at the distribution of the resale price across flat type. As expected, the bigger the flat the higher the resale price, and resale flat prices are higher in the Central region. Of course, these comparisons don’t take into account the floor size, which bring us to our next analysis.

Resale Public Housing Prices in 2015
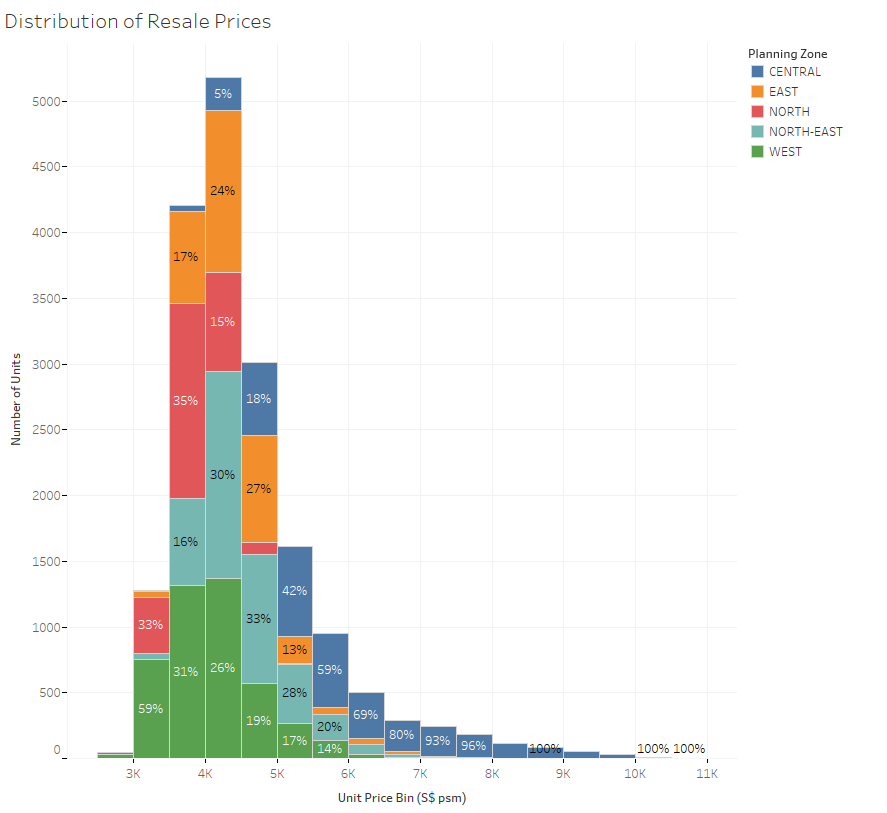
Looking at the distribution of resale flat prices across regions, we note that besides the distribution being skewed to the right, unit prices in the Central region are significantly higher than that in the West, followed by North East and the East region.
This brings us to the question: Does the old adage that location is key in real estate holds true in 2015? We’ll delve deeper into this in our next set of charts.
The below map provides a quick overview of the median unit price across the 26 HDB towns.

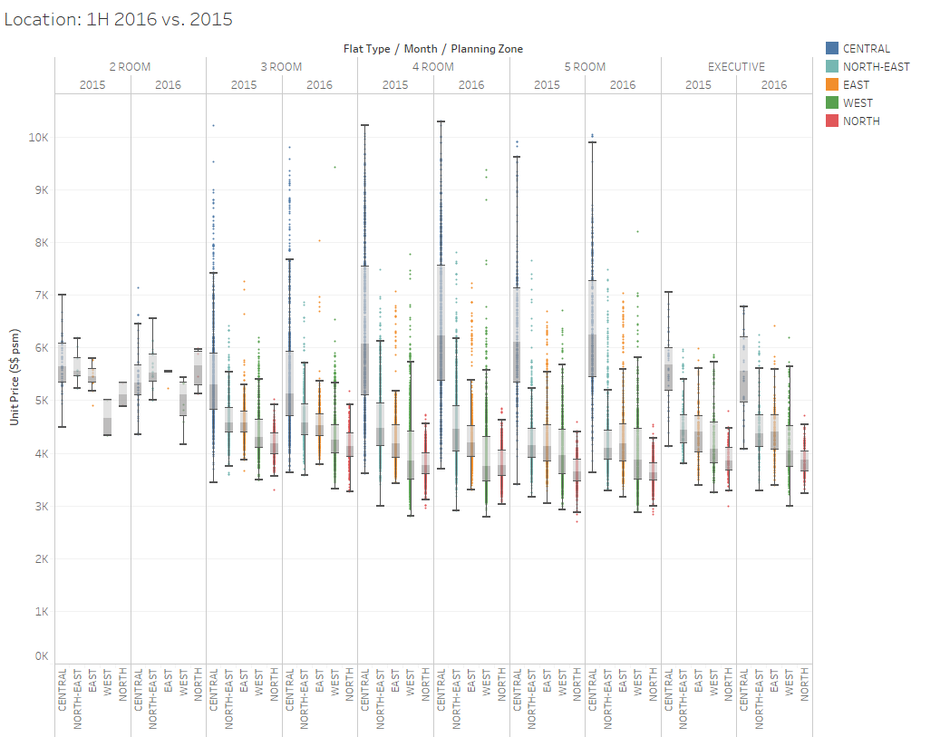
Location is a key factor in explaining the variation in unit prices across the various flat types. Flats of roughly about the same size in the Central region command a significant premium. One interesting observation which was not obvious from the above charts was that unit prices in the West are slightly higher than that in the North. This is likely due to Singapore government’s plan to significantly develop the infrastructure in the West to make it a better place to live and work.
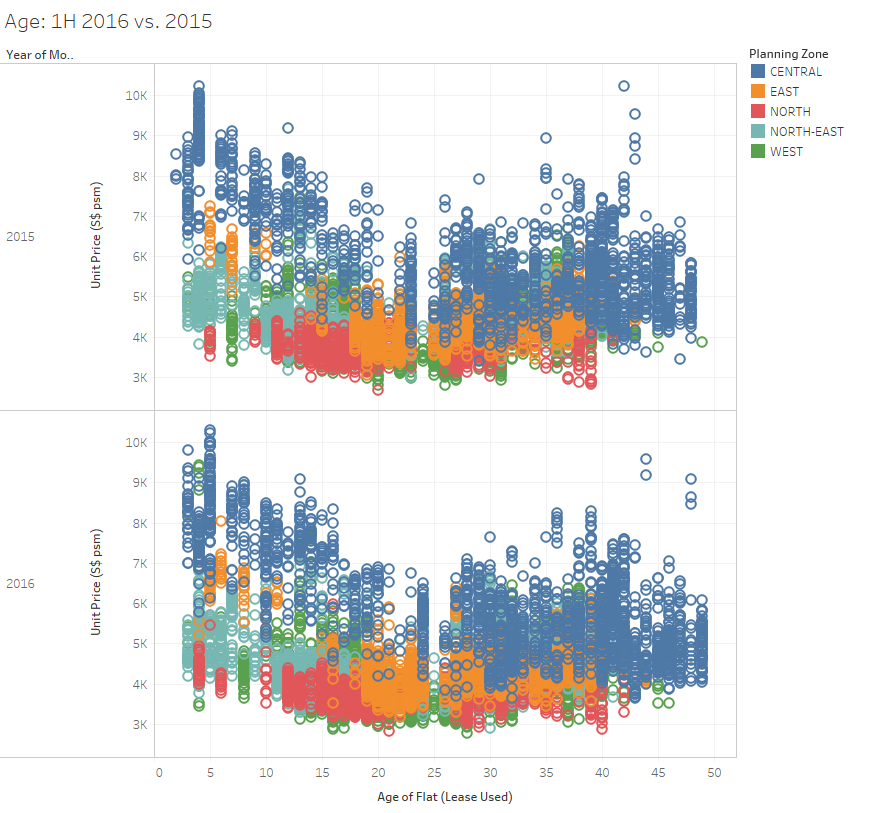
I next investigated the relationship between unit price and age of the flat. As suspected, the older the flat the lower the unit price. This observation was applicable across all regions. Of note are prices of older flats in the Central region are still able to maintain their “premiumness” vis-à-vis even younger flats in the outer Central region.

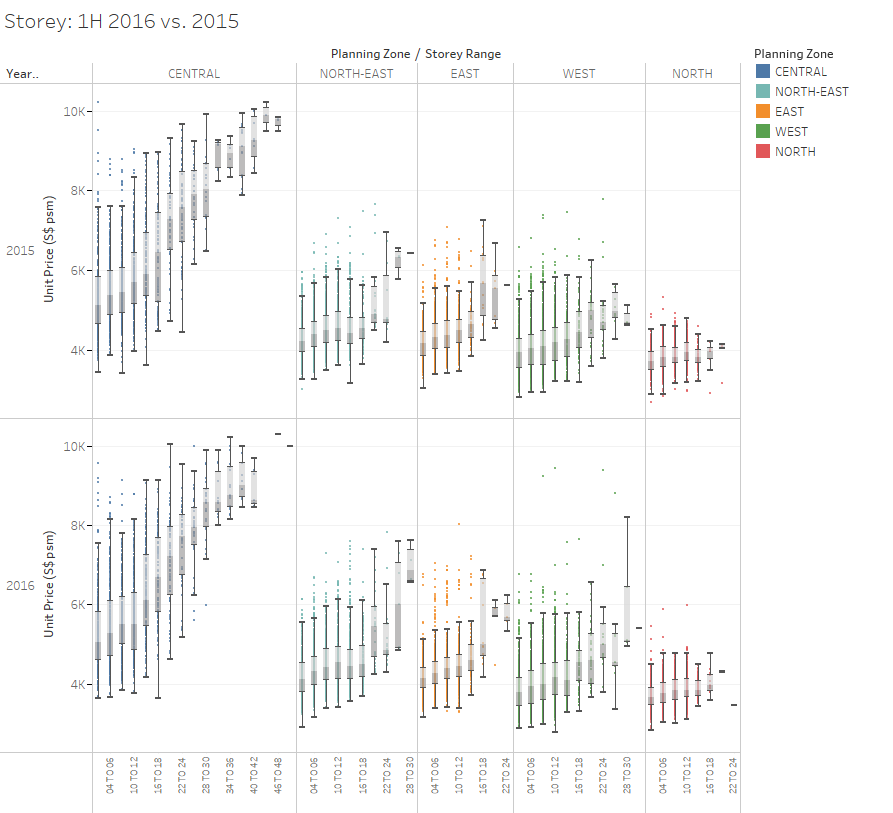
I next looked into the relationship between unit price and the storey range. As expected, properties located on the higher floors are preferred to those on the lower floors and as such command a premium. The size of the premium is noticeably larger in the case of flats located in the Central region.

Resale Public Housing Market: 1H 2016 vs. 2016
Resale transaction volume has generally picked-up across the board in the first six months of 2016 (“1H 2016”), with notable increases in resale transactions in Choa Chu Kang and Seng Kang.
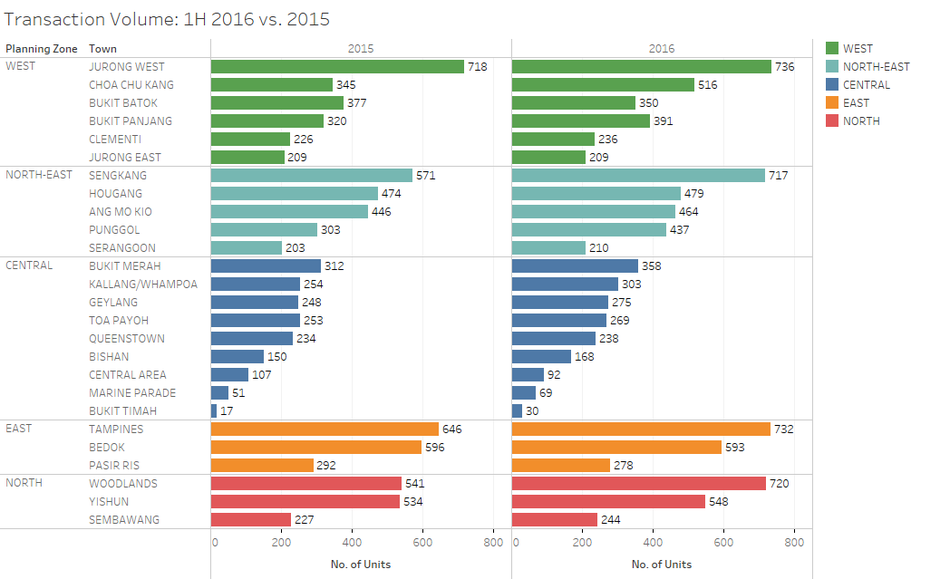
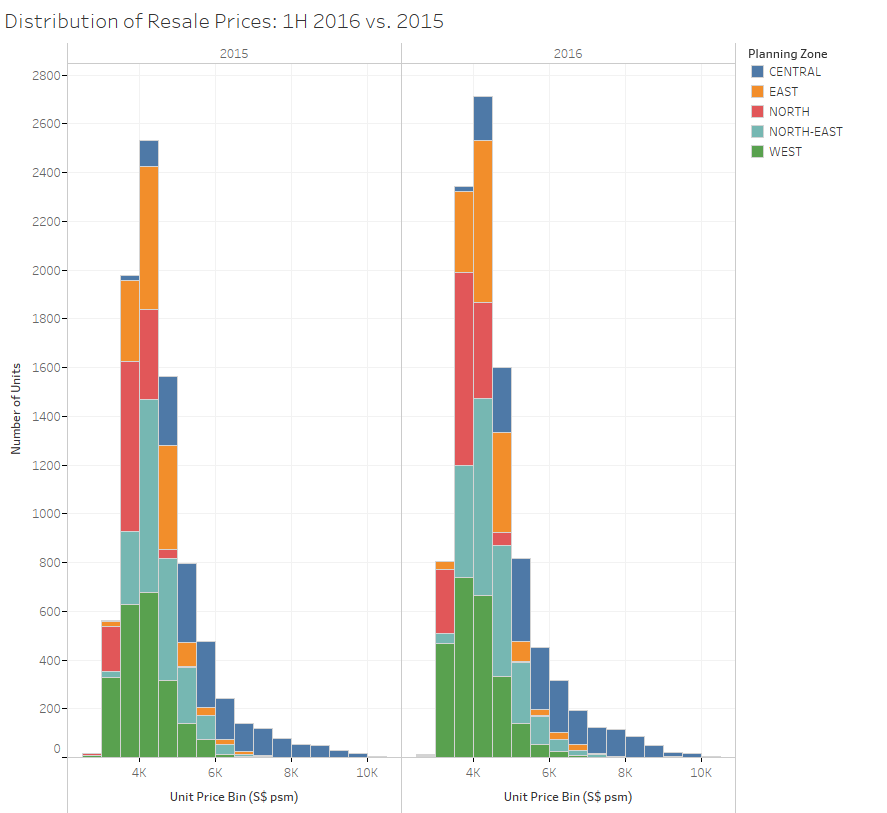
Unit resale prices in 1H 2016 were more or less at about the same level as last year, pointing perhaps towards a stabilising market.

With reference to the earlier findings, I note that the patterns observed in 1H 2016 were broadly in line with that of 1H 2015 as illustrated below:

Results
With reference to the above burning questions, it seems perhaps opportune to start monitoring the housing market for any signs of stabilisation or uptick and we note that locations is one of the most important factors in determining the value of a property.
Based on a high level assessment, a 4-room resale HDB in the Central region (to be near town) would easily cost upwards of S$550,000, with a 4-room flat at Pinnacle@Duxton transacting at S$850,000.
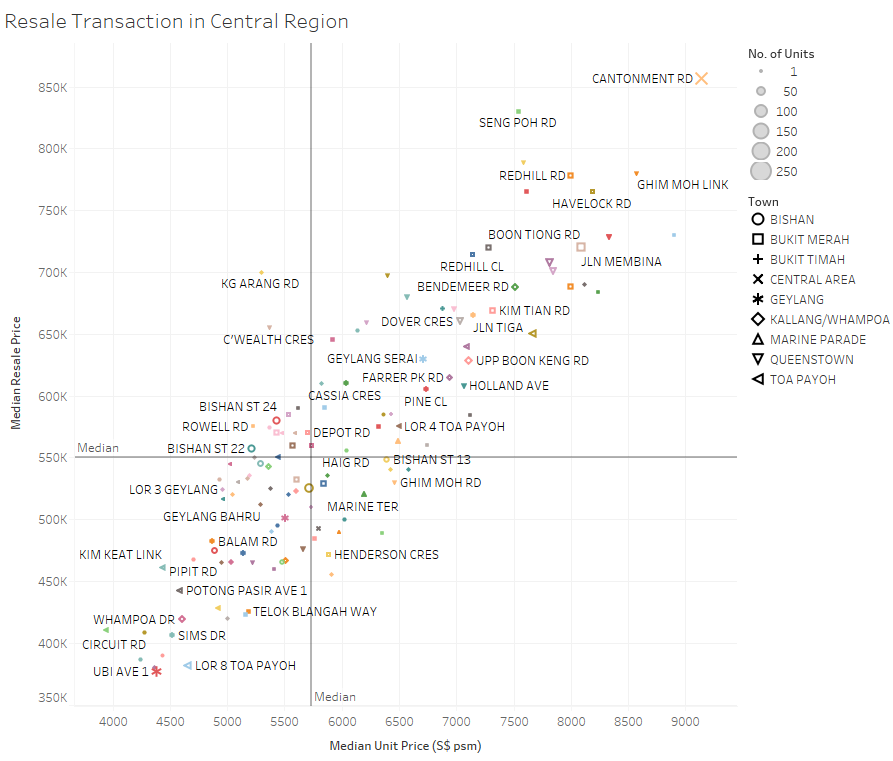
From the above findings, we also note that other characteristics of a property such as its size, age i.e. remaining lease period, and floor levels have also an important bearing on the value of the property. There are however other considerations such as the flat layout, accessibility and neighbourhood which are not captured in the data set.
