Difference between revisions of "ISSS608 2016 17T1 Group14 Report"
Jump to navigation
Jump to search
| Line 7: | Line 7: | ||
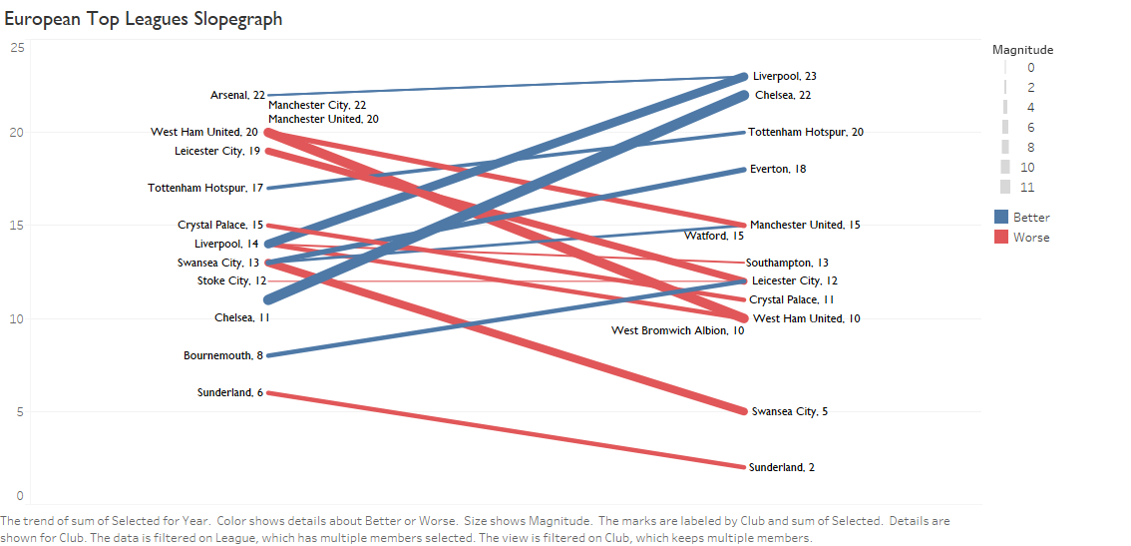
= Results and Insights = | = Results and Insights = | ||
Results | Results | ||
| + | [[File:Slopegraph.png]] | ||
= Future Work = | = Future Work = | ||
Revision as of 16:01, 24 November 2016
Contents
Motivation
One of the most popular sports worldwide is football. Football can be considered as the most favourite sport in the world, especially in Europe. The motivation of this project is to discover interesting findings about the top 4 leagues in Europe. (England, Spain, Italy, Germany).
Application
Application
Results and Insights
Future Work
- Visualize football data from other continents (Asia, America,Africa)
- Include more seasons in the visualization
- Explore other data visualization techniques like parallel coordinates or radar chart.
Guides
Installation Guide
To install,
User Guide
To use,
References
http://www.storytellingwithdata.com/blog/2014/03/more-on-slopegraphs
http://dataremixed.com/2013/12/slopegraphs-in-tableau/
https://eagereyes.org/parallel-sets
