Difference between revisions of "ISSS608 2016-17 T1 Assign3 Shishir Nehete"
| Line 137: | Line 137: | ||
As we know about these 2 locations, further analysis on the check-ins to these 2 locations gave insights that these are the 2 locations which were shut down by the park authorities immediately as the crime was discovered. These locations were not re-opened the whole day as there are no check-ins, which confirm the hypothesis that some damage was done at these locations.<br/> | As we know about these 2 locations, further analysis on the check-ins to these 2 locations gave insights that these are the 2 locations which were shut down by the park authorities immediately as the crime was discovered. These locations were not re-opened the whole day as there are no check-ins, which confirm the hypothesis that some damage was done at these locations.<br/> | ||
| − | The link to visualize and explore this data, please follow this link to tableau public. () | + | The link to visualize and explore this data, please follow this link to tableau public. (https://public.tableau.com/views/Communication_by_IDs/OutstandingCommunicationIDsFri?:embed=y&:display_count=yes) |
<br clear="all"/> | <br clear="all"/> | ||
| Line 144: | Line 144: | ||
<br/> | <br/> | ||
*https://public.tableau.com/views/Communication_by_IDs/OutstandingCommunicationIDsFri?:embed=y&:display_count=yes | *https://public.tableau.com/views/Communication_by_IDs/OutstandingCommunicationIDsFri?:embed=y&:display_count=yes | ||
| − | * | + | *https://public.tableau.com/views/Communication_by_IDs/OutstandingCommunicationIDsFri?:embed=y&:display_count=yes |
<br clear="all"/> | <br clear="all"/> | ||
Revision as of 19:29, 30 October 2016
To be a Visual Detective: Detecting spatio-temporal patterns
Contents
Overview
DinoFun World is a typical modest-sized amusement park, sitting on about 215 hectares and hosting thousands of visitors each day. It has a small town feel, but it is well known for its exciting rides and events.
Our task is to analyse the data for one event, which was organized last year as a weekend tribute to Scott Jones, internationally renowned football (“soccer,” in US terminology) star. Scott Jones is from a town nearby DinoFun World. He was a classic hometown hero, with thousands of fans who cheered his success as if he were a beloved family member. However, the event was marred by crime and mayhem perpetrated by a poor, misguided and disgruntled figure from Scott’s past.
In view of this mayhem, we are supposed to investigate the in-app communication data over the three days and try to figure out the patterns of communications and make hypothesis of when the vandalism was discovered.
Task
We have access to the in-app communication data over the three days of the Scott Jones celebration. This includes communications between the paying park visitors, as well as communications between the visitors and park services. In addition, the data also contains records indicating if and when the user sent a text to an external party. Our task is to use visual analytics techniques to analyze the available data and develop responses to the questions below.
- Identify those IDs that stand out for their large volumes of communication. For each of these IDs
- Characterize the communication patterns you see.
- Based on these patterns, what do you hypothesize about these IDs?
- Describe up to 10 communications patterns in the data. Characterize who is communicating, with whom, when and where. If you have more than 10 patterns to report, please prioritize those patterns that are most likely to relate to the crime.
- From this data, can you hypothesize when the vandalism was discovered? Describe your rationale.
Data
Data Preparation
Visualization Software
- JMP Pro - For Data cleaning, transformation and visualization
- Tableau - For data visualization
- Gephi - For Graph visualization using nodes and edges
Results
Task 1
Below figure shows the data for communication that happened on Friday.
Below figure shows the data for communication that happened on Saturday.
Below figure shows the data for communication that happened on Sunday.
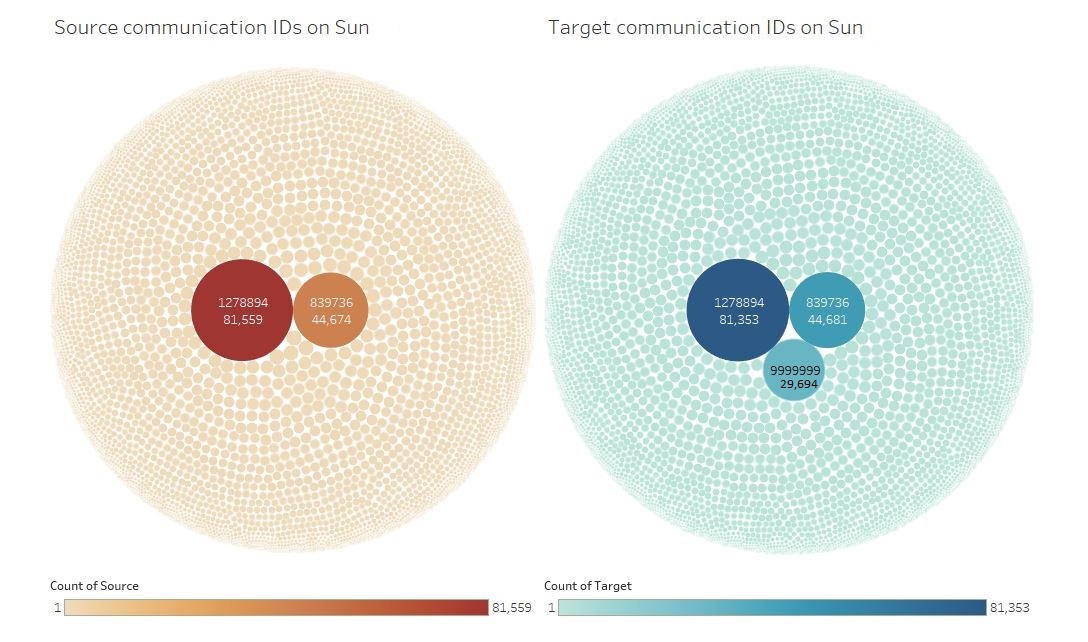
While analysing the communication data for all three days, it is observed that there are 2 IDs that stand out in the communications happening in the park.
These 2 IDs are 1278894 and 839736. Other ID that is target of high communication is 9999999, which refers to external party.
Further analysing the data for ID 1278894, it is observed that this ID communicates with majority of the visitors in the park. Hence it can be hypothesized that this ID can be check-in monitoring ID in the park setup. Also, this ID is located at Entry Corridor which confirms the hypothesis.
The other ID i.e. 839736, which also communicates with high number of visitors to the park can be hypothesized as a kind of Service ID in the park. This ID also is located at the Entry Corridor.
We will further analyse the communication patterns of these IDs in the 2nd task that describes the communication patters.
Another noticeable point to note out of this analysis is that the communication has drastically increased with the ID 839736 on Sunday tough the number of visitors is close to the number on Saturday.
As seen in the table above, the communication with 839736 has increased 4 folds while the increase in visitors and check-in monitoring has not significantly changed over Sunday.
This data can be visualized and explored at the link to tableau public. (https://public.tableau.com/views/Communication_by_IDs/OutstandingCommunicationIDsFri?:embed=y&:display_count=yes)
Task 2
The task is to explore and describe communications patterns in the data. Characterize who is communicating, with whom, when and where. And while doing so, try to find patterns that are most likely to relate to the crime.
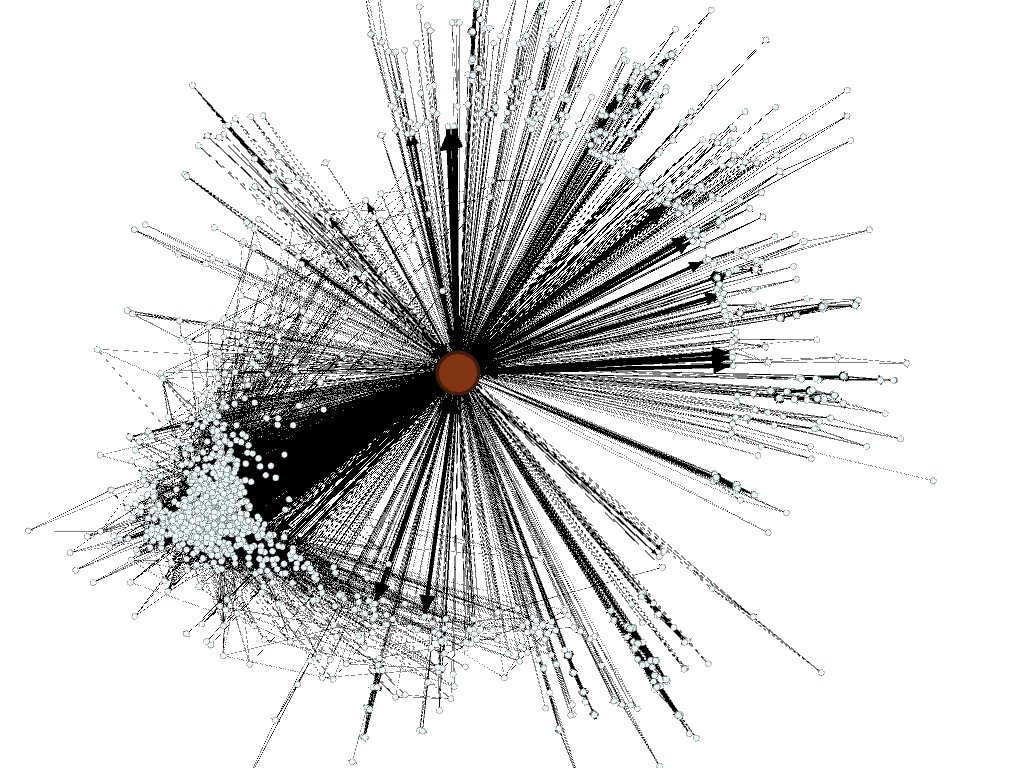
1. Analyse the communication pattern of ID 1278894 which has maximum communications – Monitoring ID.
As the graph above shows, the ID is communicating with almost all visitors. Also based on the movement data, the location of the ID is Entry Corridor. Hence, it is confirmed that the ID is a monitoring ID setup by the park authorities, which communicates with all the visitors at specific time intervals. So going further, to analyse the communication, this ID will not be considered as a suspect ID. After analysing the communication pattern for this ID, the In-Degree and Out-Degree for this ID is almost same which means that it responds back as soon as it receives messages from the visitors.
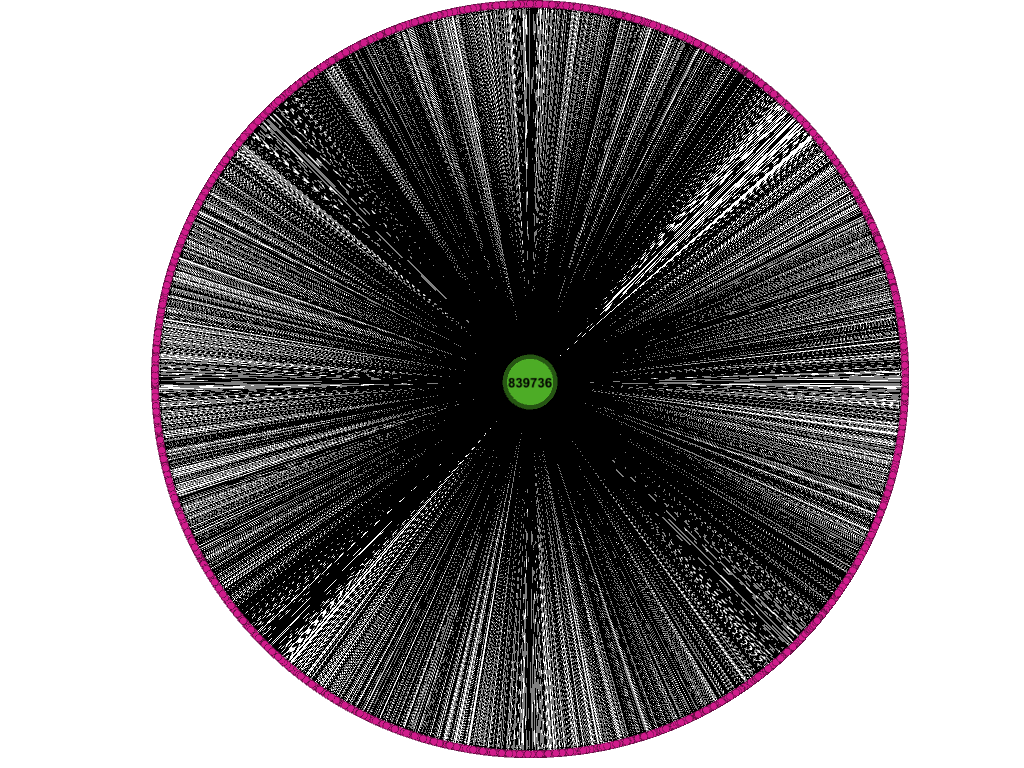
2. Analyse the communication pattern of ID 839736 – Service ID.
As seen from the above graph, this ID has a very active communication pattern with lot of visitors. The location of this ID in the communication data provided is also Entry Corridor. The communication has spiked on the last day which is confirmed from the prior task. So the hypothesis that this a Service ID setup by the park is justified.
3. Friday Communication pattern.
As our aim is to understand the communication pattern that leads to the crime, so excluding the above 2 IDs for analysis.
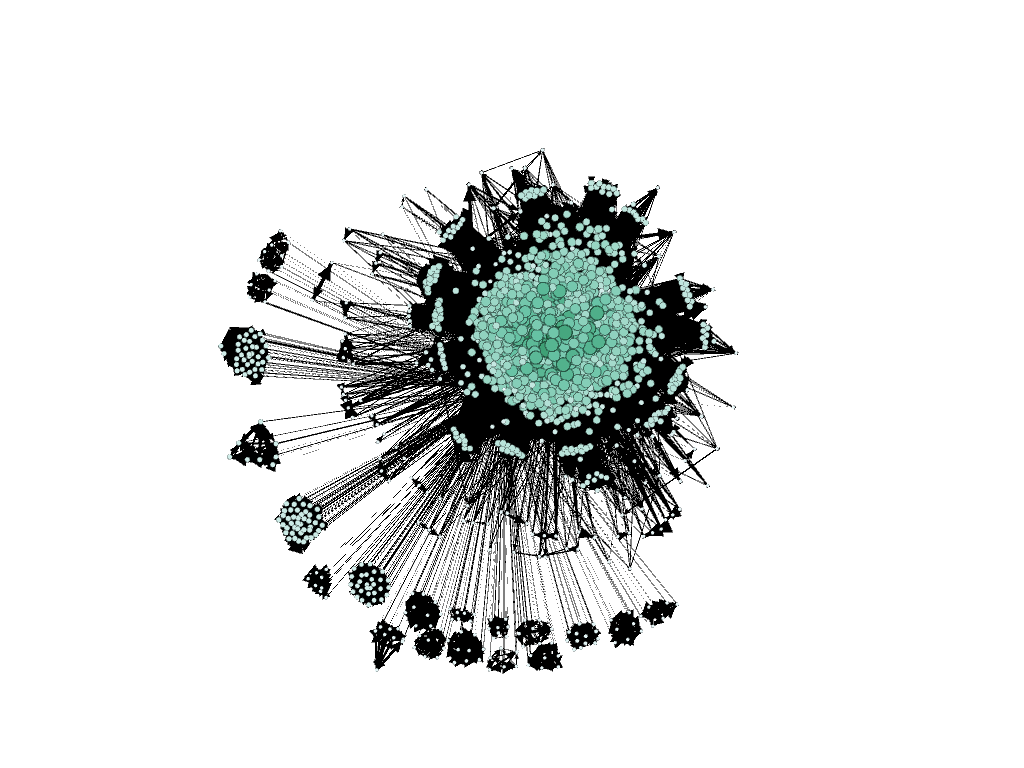
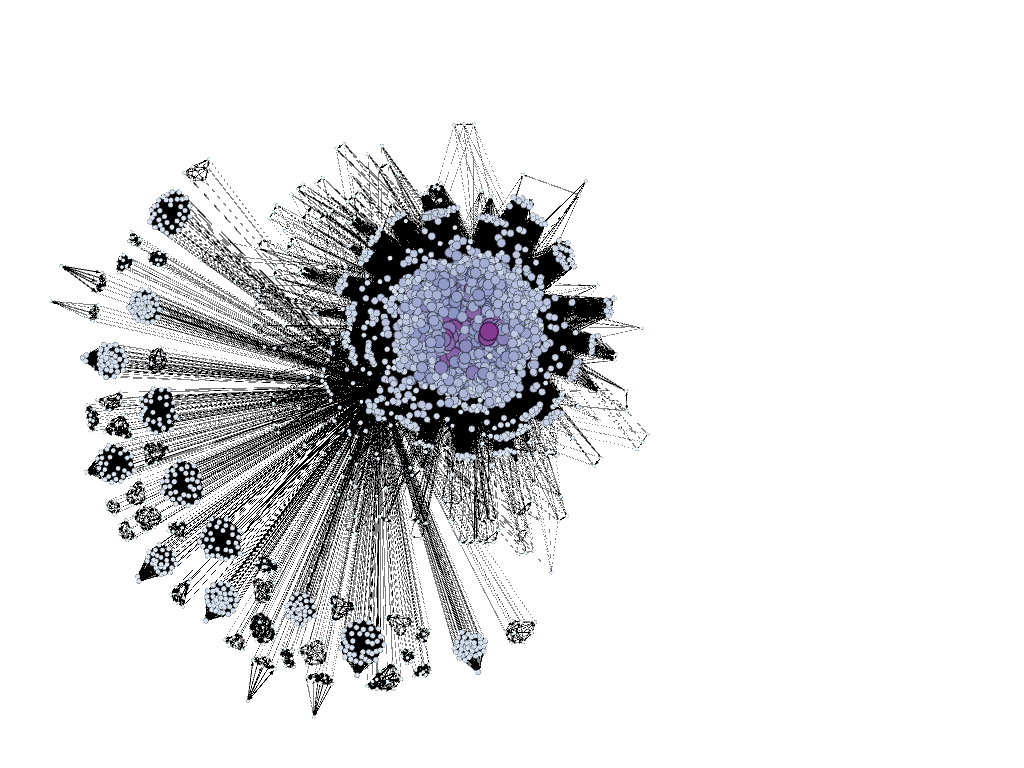
Above graph shows that the communication is spread out and there is no specific ID for which the out degree is too huge.
This also confirms that the crime was not initiated on this day.
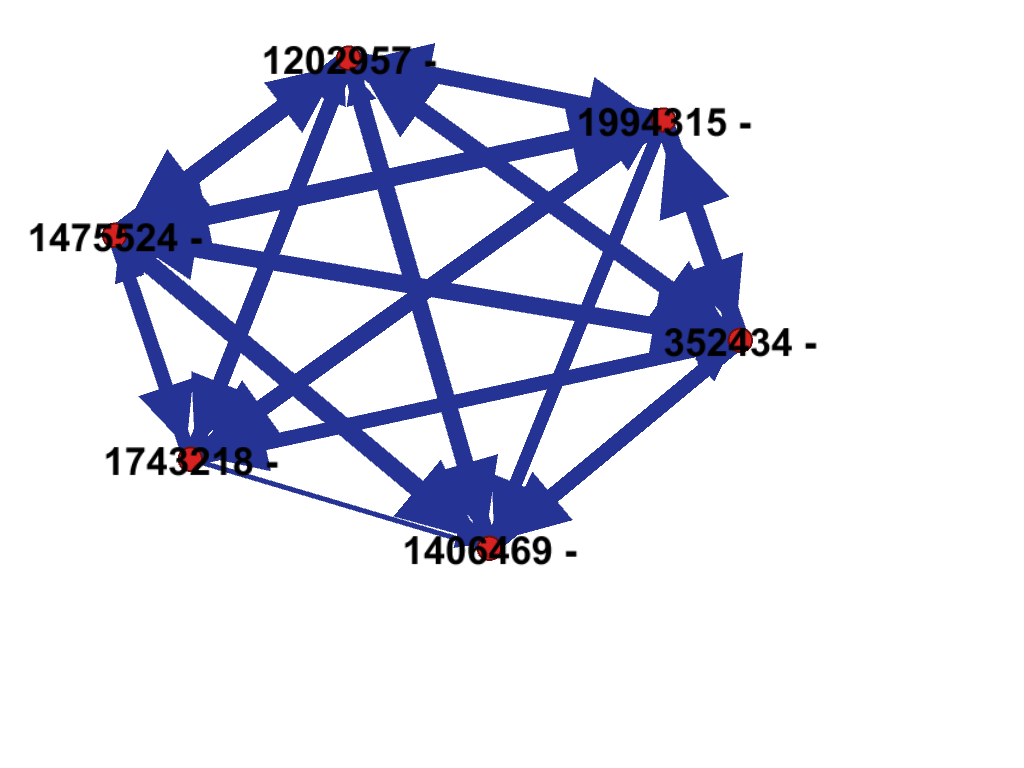
Above graph shows one of the pattern in the communication. This is a small group of people who interact mostly with in themselves and have very less interaction with other groups or IDs. It can be hypothesized that such small groups are either families or a group of friends who have come to the park for enjoying their holiday.
4. Saturday communication pattern.
As done previously, excluding the 2 service IDs for analysis.
There is a sharp increase in the number of communications happening on Saturday as compared to Friday. This is in line with the high increase in the number of visitors on Saturday compared to Friday. Above graph shows that the communication on Saturday too is spread out and there is no specific ID or IDs for which the out degree is huge.
Similar to that on Friday, the pattern is repeated in which there is a small group of people who interact mostly with in themselves and have very less interaction with other groups or IDs. It can be hypothesized that such small groups are either families or a group of friends.
5. Sunday Communication Pattern.
While analysing the communication data for Sunday, it is observed that there is a spike in communication on this day compared to prior 2 days. This is alarming as the number of visitors have not spiked as large as the communication. One more notable point is that the communication with the service ID has increased 4 folds as compared to Friday. The high Degree for the service ID(839736) can be seen in the graph below.
As the communication to this ID and external ID is done for reporting the event of vandalism, it is necessary to exclude these IDs from the data to analyse further to get insights about the communication that has happened within the group of visitors. Hence, these IDs are excluded from the data used for further analysis
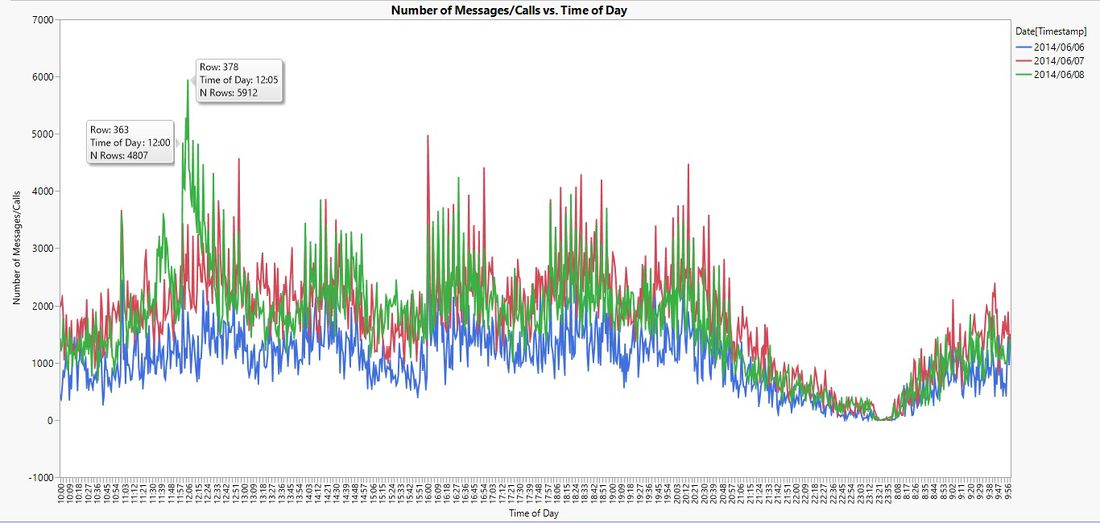
Also, as the communication spike has happened at 12:05 and has dropped gradually, the communication data is taken till 13:00 hours for analysis. (This can be seen in the task 3 Timeseries Communication Image)
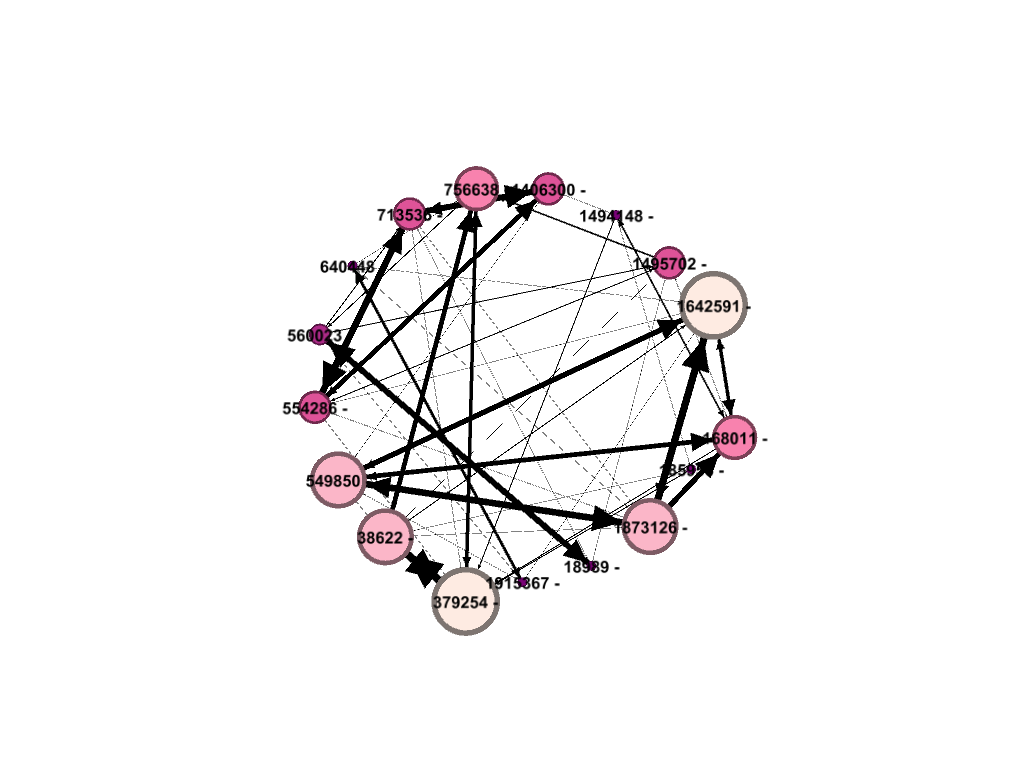
After further analysis, it is observed that there are some IDs that have a very high degree of calls. So the filter is used for checking the IDs that have more than 80% density of calls in the duration till 12 PM. Above graph shows these IDs.
Above graph shows the Out-Degree for these IDs. This shows that the IDs 554286 and 168011 are the ones who have originated maximum calls.
Above graph shows the In-Degree for the IDs that are being observed. This shows that the IDs 1642591 and 379254 have maximum incoming communication.
Taking into account the event of vandalism, this group of IDs can be considered as suspect IDs who might have played a part in the crime that happened in the park.
Task 3
The task is to hypothesize when the vandalism was discovered.
After carrying out the analysis of data, it is observed that the communications spiked in the duration from 12 to 12.10 as marked in the figure above. This proves that most of the visitors tried to contact either the Service ID of the park or the external sources for reporting the vandalism. Based on the timings of the vandalism, i.e. on Sunday at around 12, further analysis was carried out regarding the possible locations of the crime.
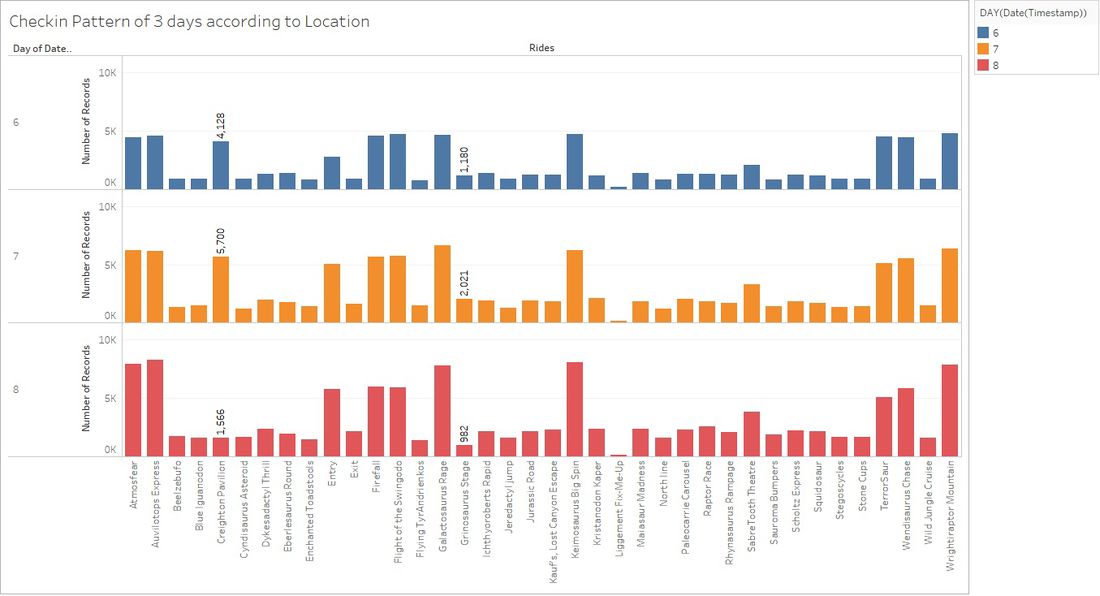
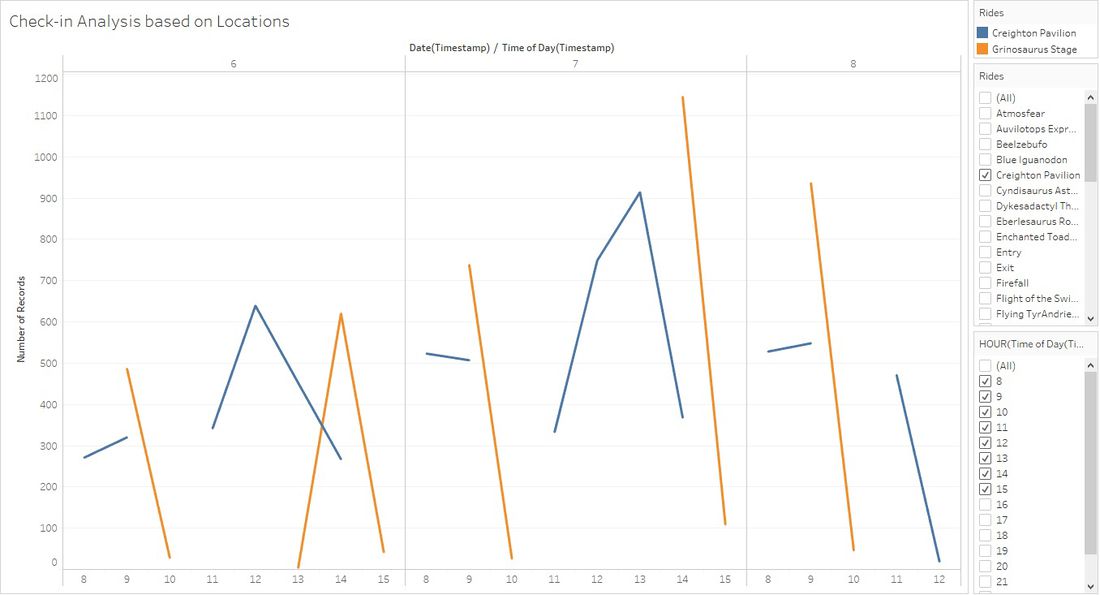
As seen in the above figure, the check-ins at 2 locations have suddenly dropped on Sunday as compared to the variations for check-ins at other locations. These 2 locations are Creighton Pavilion and Grinosaurus Stage.
As we know about these 2 locations, further analysis on the check-ins to these 2 locations gave insights that these are the 2 locations which were shut down by the park authorities immediately as the crime was discovered. These locations were not re-opened the whole day as there are no check-ins, which confirm the hypothesis that some damage was done at these locations.
The link to visualize and explore this data, please follow this link to tableau public. (https://public.tableau.com/views/Communication_by_IDs/OutstandingCommunicationIDsFri?:embed=y&:display_count=yes)
Tableau Links
- https://public.tableau.com/views/Communication_by_IDs/OutstandingCommunicationIDsFri?:embed=y&:display_count=yes
- https://public.tableau.com/views/Communication_by_IDs/OutstandingCommunicationIDsFri?:embed=y&:display_count=yes
Comments


