Difference between revisions of "ISSS608 2016 17T1 Group14 Application"
Jump to navigation
Jump to search
| (One intermediate revision by the same user not shown) | |||
| Line 5: | Line 5: | ||
<br> | <br> | ||
====User Guide==== | ====User Guide==== | ||
| − | Open the link | + | # Open the link to view the graph : [https://rawgit.com/FrandyEddy/Project/master/Bundesliga_ParallelSet.html Parallel Sets] |
| − | [https://rawgit.com/FrandyEddy/Project/master/Bundesliga_ParallelSet.html Parallel Sets] | + | # Choose the League and the attributes to visualize (e.g. League = Barclays Premier League, attributes = Home Team, FTR, HTR) and click "Update" |
| − | The source code can be accessed on | + | # You can dynamically change the order or placement of the categories by dragging it to the place you want |
| − | [https://github.com/FrandyEddy/Project Code] | + | # The source code can be accessed on this link: [https://github.com/FrandyEddy/Project Code] |
===Tableau Public Link=== | ===Tableau Public Link=== | ||
Latest revision as of 15:20, 28 November 2016
Contents
Graphs
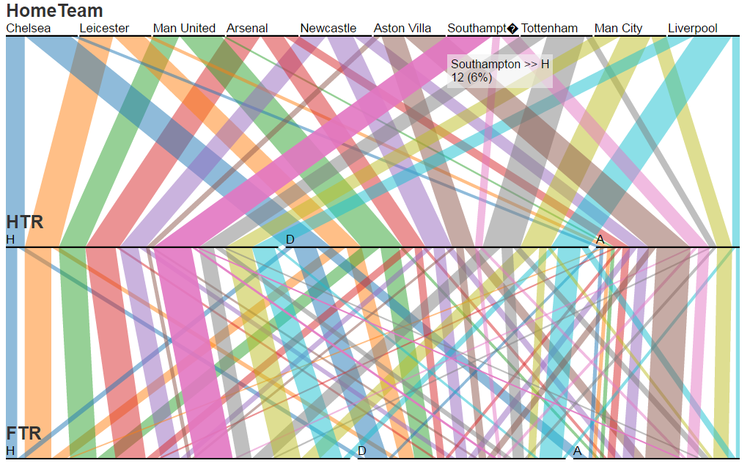
Parallel Sets
User Guide
- Open the link to view the graph : Parallel Sets
- Choose the League and the attributes to visualize (e.g. League = Barclays Premier League, attributes = Home Team, FTR, HTR) and click "Update"
- You can dynamically change the order or placement of the categories by dragging it to the place you want
- The source code can be accessed on this link: Code
Tableau Public Link
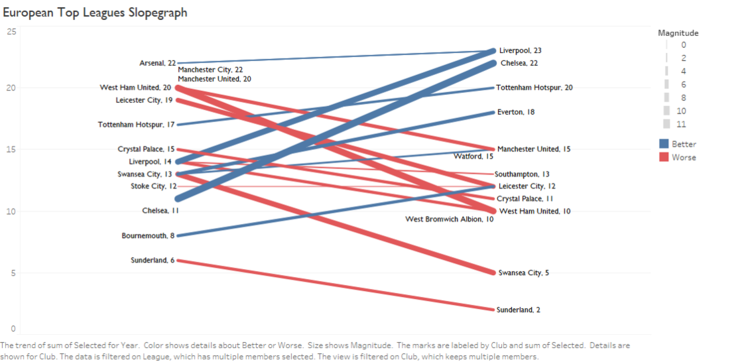
Slopegraph
User Guide
- Open the links to view the graph.
- Use filters for different combinations.
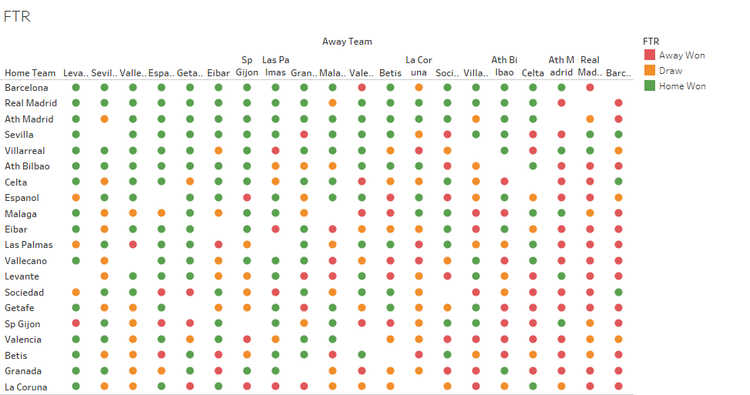
Full Time Results
User Guide
- Open the links to view the graph.
- Use filters for different combinations.


