Difference between revisions of "ISSS608 2016-17 T1 Assign2 WEI Jingxian"
(Created page with "== Abstract == == Problem and Motivation== ;* ?? :1. :2. :3. :4.") |
|||
| (55 intermediate revisions by the same user not shown) | |||
| Line 1: | Line 1: | ||
| − | |||
| − | == | + | ==Motivation and Problems== |
| + | Wikipedia is commonly used in our study and research, but there must be something disappointed users. From Wikipedia aspect, it is essential to know about the attitudes of users, especially university faculty. Because most of university faculty use Wikipedia as an academic reference or a teaching resource and they have more knowledge on their domain, they would be a valuable source of feedback about how well Wikipedia done and what need to be improved in academic area.Based on the survey, Wikipedia can know the attitudes of faculty and improve its performance. | ||
| + | <br /> | ||
| + | Basically, we would like to know what are the best items and what are the worst items. In addition, we want to explore different preference of faculty with different profile. In more detail, the questions we want to know are listed: | ||
| − | ;* ?? | + | ;* What is the demographic for these university faculty? |
| − | :1. | + | ;* At category level |
| − | :2. | + | :1. Which category has the best / worst response? |
| − | :3. | + | :2. What is the response of faculty in different domain or position? |
| − | :4. | + | |
| + | ;* At question level | ||
| + | :1. The overall result and what are the questions have the best / worst response? | ||
| + | :2. What is the response of faculty in different domain or position? | ||
| + | :3. Is there any interesting difference among different group of faculty? | ||
| + | |||
| + | == Data Information == | ||
| + | There is a survey on university faculty perceptions and practices of using Wikipedia as a teaching resource. There are totally 43 questions from 13 categories covered in the survey, and the response ranges from 1, which means strongly disagree to 5, which means strongly agree. The dataset can be download from following link. [https://archive.ics.uci.edu/ml/datasets/wiki4HE Wiki4HE Data Set] | ||
| + | <br /> | ||
| + | There are 10 variables recorded participants' profile, including age, gender, domain, PhD or not, years of university teaching experience, university, UOC position, other and other position, and Wikipedia registered user or not. All the information is presented by numbers. | ||
| + | For survey questions, the following table shows the 13 categories and corresponding questions. | ||
| + | {| class="wikitable sortable" | ||
| + | |- | ||
| + | ! No. !! Survey Categories !! Corresponding Survey Questions | ||
| + | |- | ||
| + | | 1 || Perceived usefulness || | ||
| + | PU1: The use of Wikipedia makes it easier for students to develop new skills <br /> | ||
| + | PU2: The use of Wikipedia improves students' learning <br /> | ||
| + | PU3: Wikipedia is useful for teaching | ||
| + | |- | ||
| + | | 2 || Perceived ease of use || | ||
| + | PEU1: Wikipedia is user-friendly <br /> | ||
| + | PEU2: It is easy to find in Wikipedia the information you seek <br /> | ||
| + | PEU3: It is easy to add or edit information in Wikipedia | ||
| + | |- | ||
| + | | 3 ||Perceived enjoyment || | ||
| + | ENJ1: The use of Wikipedia stimulates curiosity <br /> | ||
| + | ENJ2: The use of Wikipedia is entertaining | ||
| + | |- | ||
| + | | 4 || Quality || | ||
| + | QU1: Articles in Wikipedia are reliable <br /> | ||
| + | QU2: Articles in Wikipedia are updated <br /> | ||
| + | QU3: Articles in Wikipedia are comprehensive <br /> | ||
| + | QU4: In my area of expertise, Wikipedia has a lower quality than other educational resources <br /> | ||
| + | QU5: I trust in the editing system of Wikipedia | ||
| + | |- | ||
| + | | 5 || Visibility || | ||
| + | VIS1: Wikipedia improves visibility of students' work <br /> | ||
| + | VIS2: It is easy to have a record of the contributions made in Wikipedia | ||
| + | |- | ||
| + | | 6 || Social image || | ||
| + | IM1: The use of Wikipedia is well considered among colleagues <br /> | ||
| + | IM2: In academia, sharing open educational resources is appreciated <br /> | ||
| + | IM3: My colleagues use Wikipedia | ||
| + | |- | ||
| + | | 7 || Sharing attitude || | ||
| + | SA1: It is important to share academic content in open platforms <br /> | ||
| + | SA2: It is important to publish research results in other media than academic journals or books <br /> | ||
| + | SA3: It is important that students become familiar with online collaborative environments | ||
| + | |- | ||
| + | | 8 || Use behavior || | ||
| + | USE1: I use Wikipedia to develop my teaching materials <br /> | ||
| + | USE2: I use Wikipedia as a platform to develop educational activities with students <br /> | ||
| + | USE3: I recommend my students to use Wikipedia <br /> | ||
| + | USE4: I recommend my colleagues to use Wikipedia <br /> | ||
| + | USE5: I agree my students use Wikipedia in my courses | ||
| + | |- | ||
| + | | 9 || Profile 2.0 || | ||
| + | PF1: I contribute to blogs <br /> | ||
| + | PF2: I actively participate in social networks <br /> | ||
| + | PF3: I publish academic content in open platforms | ||
| + | |- | ||
| + | | 10 || Job relevance || | ||
| + | JR1: My university promotes the use of open collaborative environments in the Internet <br /> | ||
| + | JR2: My university considers the use of open collaborative environments in the Internet as a teaching merit | ||
| + | |- | ||
| + | | 11 || Behavioral intention || | ||
| + | BI1: In the future I will recommend the use of Wikipedia to my colleagues and students <br /> | ||
| + | BI2: In the future I will use Wikipedia in my teaching activity | ||
| + | |- | ||
| + | | 12 || Incentives || | ||
| + | INC1: To design educational activities using Wikipedia, it would be helpful: a best practices guide <br /> | ||
| + | INC2: To design educational activities using Wikipedia, it would be helpful: getting instruction from a colleague <br /> | ||
| + | INC3: To design educational activities using Wikipedia, it would be helpful: getting specific training <br /> | ||
| + | INC4: To design educational activities using Wikipedia, it would be helpful: greater institutional recognition | ||
| + | |- | ||
| + | | 13 || Experience || | ||
| + | EXP1: I consult Wikipedia for issues related to my field of expertise <br /> | ||
| + | EXP2: I consult Wikipedia for other academic related issues <br /> | ||
| + | EXP3: I consult Wikipedia for personal issues <br /> | ||
| + | EXP4: I contribute to Wikipedia (editions, revisions, articles improvement...) <br /> | ||
| + | EXP5: I use wikis to work with my students | ||
| + | |- | ||
| + | |} | ||
| + | |||
| + | == Data Preparation == | ||
| + | === Replacement=== | ||
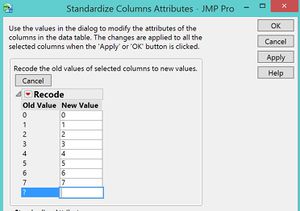
| + | First of all, it is necessary to check the missing data before we start analysing. There are many '?' excited in several columns, and JMP would treat these columns as character, which is inappropriate data type for answers. Thus, we need to replace all the '?' with null value and change the type of answers into numeric. | ||
| + | [[File:Replace.JPG|300px|frameless|center]] | ||
| + | === Calculation in JMP === | ||
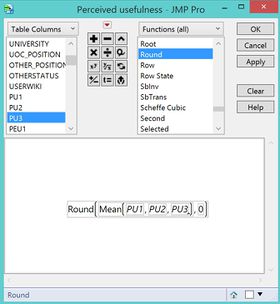
| + | In order to check the overall performance of each category, we calculate the averages of questions under each category, and use them to represent the responses of categories. | ||
| + | The sample formula is shown in the screenshot below. | ||
| + | [[File:Formula.jpg|280px|frameless|center]] | ||
| + | === Calculation in Tableau === | ||
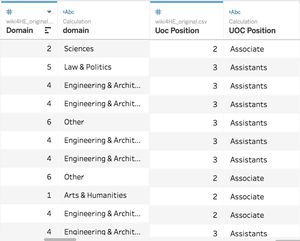
| + | In the dataset, variables related to faculty profile are measured by number, so they cannot be checked directly. Therefore, for these variables, including domain, Uoc position and gender, we create new variables with actual meanings to replace the original variables. | ||
| + | [[File:Replace2.jpeg|300px|frameless|center]] | ||
| + | Also, we create groups for age and years of university teaching experience (yearexp), so that we can present them clearer and more easily. | ||
| + | {| class="wikitable" | ||
| + | |- | ||
| + | ! Groups !! Criterion !! Groups !! Criterion | ||
| + | |- | ||
| + | | Age Groups || | ||
| + | 20+ <br /> | ||
| + | 30+ <br /> | ||
| + | 40+ <br /> | ||
| + | 50+ <br /> | ||
| + | 60+ | ||
| + | || Yearexp Groups || | ||
| + | <10 <br /> | ||
| + | <20 <br /> | ||
| + | <30 <br /> | ||
| + | >=30 | ||
| + | |} | ||
| + | |||
| + | === Format Conversion === | ||
| + | Since we would like to discover both category level and question level, and it is inefficient if we mass up two level, we imported the modified dataset twice and used them for different conversion. | ||
| + | There is a Pivot function in Tableau can help us to convert the dataset. In the he original dataset, one column represent one catogory or one question. After conversion, there would be only two columns showing the survey result. One is category / question and another is response. | ||
| + | |||
| + | [[File:Pivot.jpeg|1000px|frameless|center]] | ||
| + | |||
| + | == Exploration == | ||
| + | ===Demographic Information=== | ||
| + | Before we go into the survey result, we need to know about the participants in this survey. In the original dataset, there are 6 unique values in domain variable. But the data dictionary only provide information for 1-5 exclude 6, also there are some missing value in this variables. 'Other' in domain includes 6 and null value, but only very little part of it is null value. Also, the 'Other' in UOC position means null value. | ||
| + | [[File:Demographic.jpeg|800px|frameless|center]] | ||
| + | It is obvious that many participants are from the other domain, and the position for most of the participants is adjunct. Also, most of the participants is not the wiki register user. | ||
| + | <br /> | ||
| + | |||
| + | ===Category Level=== | ||
| + | First of all, we would like to see the overall results by categories. The categories with best response is sharing attitude, and it shows that most of the participants think it is important for students to make academic use of online open resource. Also, they think Wikipedia is easy to use and it is entertaining. It is also important for us to know the aspect of usefulness, but unfortunately the response for this category is just around the average. The worst response is for user behavior and it means that most of the participants would not like to use Wikipedia to develop educational activities or use as a teaching materials. | ||
| + | [[File:Overall.jpeg|800px|frameless|center]] | ||
| + | <br /> | ||
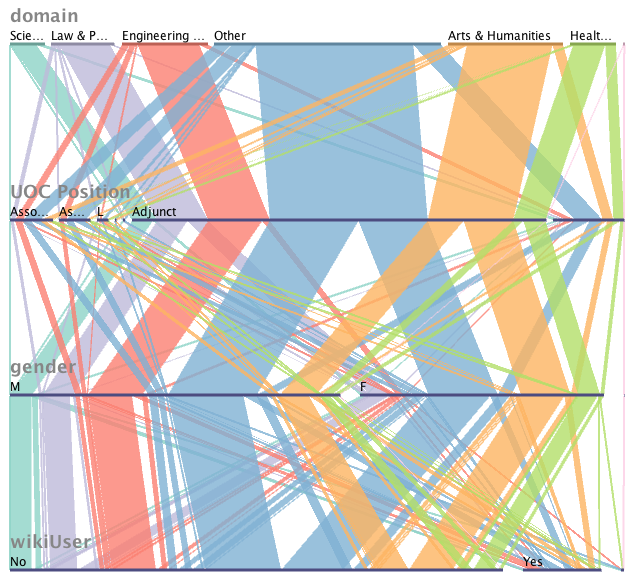
| + | The first four categories, including usefulness, easy of use, enjoyment and quality, are more important, so it it better to check the distribution. The overall response for these four categories are quite good, since most of the participants gave good response. But the response of quality is the worst, and Wiki may need to consider to improve their quality and reliance. | ||
| + | [[File:Parallel_sets.png|600px|frameless|center]] | ||
| + | No matter what is the domain or position, the overall response of registered wiki users is better than non-registered users. The trend of different domain and position is similar except for lecturer in Engineering & Architecture domain. They have higher response than others but have a extra low response for user behavior. | ||
| + | [[File:Category.jpeg|800px|frameless|center]] | ||
| + | There are totally 13 categories, and we concern about academic quality more, and based on above figure, Wiki perform not so well in quality, so we use quality as a sample. For the other categories, we can easily explore in the [https://public.tableau.com/profile/publish/Dashboard1_303/Dashboard1#!/publish-confirm Dashboard at category level]. | ||
| + | <br /> | ||
| + | The following chart shows that lecturer in Health Science gave a significant bad feedback in terms of quality. | ||
| + | [[File:Useful&domain.jpeg|800px|frameless|center]] | ||
| + | |||
| + | ===Question Level=== | ||
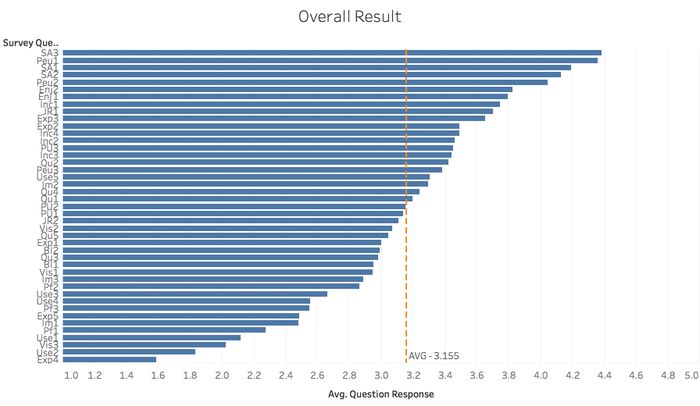
| + | The overall result at question level share the similar patterns with the result at category level. The top5 questions is about the easy of use and sharing attitude. | ||
| + | [[File:Question.jpeg|700px|frameless|center]] | ||
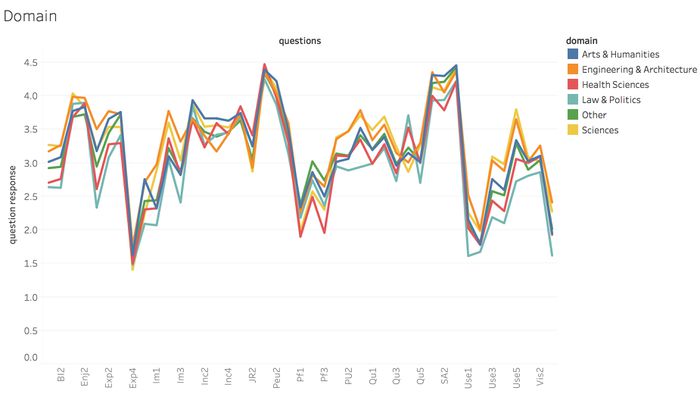
| + | The responses in different domain are almost the same, except for Law & Politics. The participants in Law & Politics domain gave the worst response for most of the questions. | ||
| + | [[File:Question&domain.jpeg|700px|frameless|center]] | ||
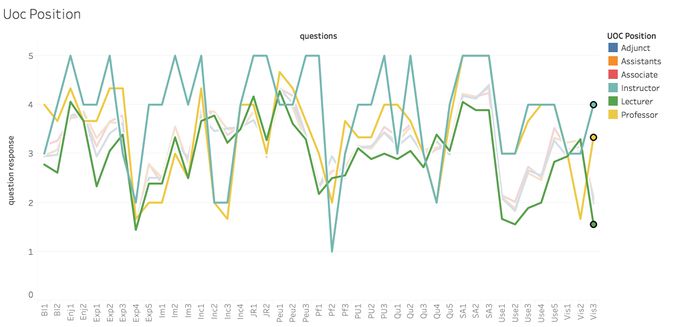
| + | The below figure shows that instructors and professors have the most dynamic response among all the questions, and it seems that most of instructors have never contributed to Wikipedia. Also, lecturers have almost the worst attitude towards Wikipedia compared with people in other positions. | ||
| + | [[File:Question&position.jpeg|700px|frameless|center]] | ||
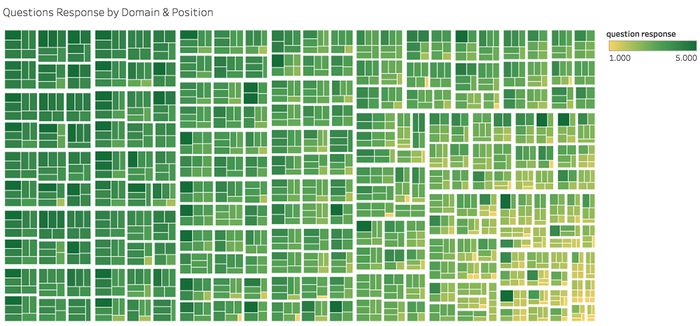
| + | In order to see the response for each questions, we would like to use treemap to present the result. The detail can be easily check by the dashboard. | ||
| + | [[File:Treemap.jpeg|700px|frameless|center]] | ||
| + | |||
| + | ==Dashboard== | ||
| + | * Dashboard at category level [https://public.tableau.com/profile/publish/Dashboard1_303/Dashboard1#!/publish-confirm] <br /> | ||
| + | * Dashboard at question level [https://public.tableau.com/profile/wei.jingxian#!/vizhome/wiki_v2_2/Dashboard2 Question Level Dashboard] | ||
| + | |||
| + | == Comments == | ||
Latest revision as of 20:29, 17 October 2016
Contents
Motivation and Problems
Wikipedia is commonly used in our study and research, but there must be something disappointed users. From Wikipedia aspect, it is essential to know about the attitudes of users, especially university faculty. Because most of university faculty use Wikipedia as an academic reference or a teaching resource and they have more knowledge on their domain, they would be a valuable source of feedback about how well Wikipedia done and what need to be improved in academic area.Based on the survey, Wikipedia can know the attitudes of faculty and improve its performance.
Basically, we would like to know what are the best items and what are the worst items. In addition, we want to explore different preference of faculty with different profile. In more detail, the questions we want to know are listed:
- What is the demographic for these university faculty?
- At category level
- 1. Which category has the best / worst response?
- 2. What is the response of faculty in different domain or position?
- At question level
- 1. The overall result and what are the questions have the best / worst response?
- 2. What is the response of faculty in different domain or position?
- 3. Is there any interesting difference among different group of faculty?
Data Information
There is a survey on university faculty perceptions and practices of using Wikipedia as a teaching resource. There are totally 43 questions from 13 categories covered in the survey, and the response ranges from 1, which means strongly disagree to 5, which means strongly agree. The dataset can be download from following link. Wiki4HE Data Set
There are 10 variables recorded participants' profile, including age, gender, domain, PhD or not, years of university teaching experience, university, UOC position, other and other position, and Wikipedia registered user or not. All the information is presented by numbers.
For survey questions, the following table shows the 13 categories and corresponding questions.
| No. | Survey Categories | Corresponding Survey Questions |
|---|---|---|
| 1 | Perceived usefulness |
PU1: The use of Wikipedia makes it easier for students to develop new skills |
| 2 | Perceived ease of use |
PEU1: Wikipedia is user-friendly |
| 3 | Perceived enjoyment |
ENJ1: The use of Wikipedia stimulates curiosity |
| 4 | Quality |
QU1: Articles in Wikipedia are reliable |
| 5 | Visibility |
VIS1: Wikipedia improves visibility of students' work |
| 6 | Social image |
IM1: The use of Wikipedia is well considered among colleagues |
| 7 | Sharing attitude |
SA1: It is important to share academic content in open platforms |
| 8 | Use behavior |
USE1: I use Wikipedia to develop my teaching materials |
| 9 | Profile 2.0 |
PF1: I contribute to blogs |
| 10 | Job relevance |
JR1: My university promotes the use of open collaborative environments in the Internet |
| 11 | Behavioral intention |
BI1: In the future I will recommend the use of Wikipedia to my colleagues and students |
| 12 | Incentives |
INC1: To design educational activities using Wikipedia, it would be helpful: a best practices guide |
| 13 | Experience |
EXP1: I consult Wikipedia for issues related to my field of expertise |
Data Preparation
Replacement
First of all, it is necessary to check the missing data before we start analysing. There are many '?' excited in several columns, and JMP would treat these columns as character, which is inappropriate data type for answers. Thus, we need to replace all the '?' with null value and change the type of answers into numeric.
Calculation in JMP
In order to check the overall performance of each category, we calculate the averages of questions under each category, and use them to represent the responses of categories. The sample formula is shown in the screenshot below.
Calculation in Tableau
In the dataset, variables related to faculty profile are measured by number, so they cannot be checked directly. Therefore, for these variables, including domain, Uoc position and gender, we create new variables with actual meanings to replace the original variables.
Also, we create groups for age and years of university teaching experience (yearexp), so that we can present them clearer and more easily.
| Groups | Criterion | Groups | Criterion |
|---|---|---|---|
| Age Groups |
20+ |
Yearexp Groups |
<10 |
Format Conversion
Since we would like to discover both category level and question level, and it is inefficient if we mass up two level, we imported the modified dataset twice and used them for different conversion. There is a Pivot function in Tableau can help us to convert the dataset. In the he original dataset, one column represent one catogory or one question. After conversion, there would be only two columns showing the survey result. One is category / question and another is response.
Exploration
Demographic Information
Before we go into the survey result, we need to know about the participants in this survey. In the original dataset, there are 6 unique values in domain variable. But the data dictionary only provide information for 1-5 exclude 6, also there are some missing value in this variables. 'Other' in domain includes 6 and null value, but only very little part of it is null value. Also, the 'Other' in UOC position means null value.
It is obvious that many participants are from the other domain, and the position for most of the participants is adjunct. Also, most of the participants is not the wiki register user.
Category Level
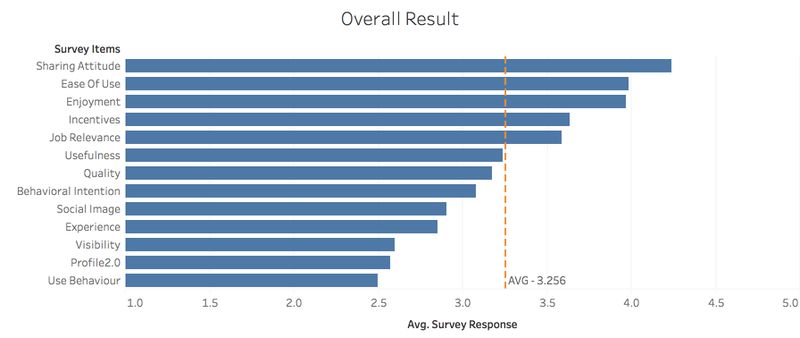
First of all, we would like to see the overall results by categories. The categories with best response is sharing attitude, and it shows that most of the participants think it is important for students to make academic use of online open resource. Also, they think Wikipedia is easy to use and it is entertaining. It is also important for us to know the aspect of usefulness, but unfortunately the response for this category is just around the average. The worst response is for user behavior and it means that most of the participants would not like to use Wikipedia to develop educational activities or use as a teaching materials.
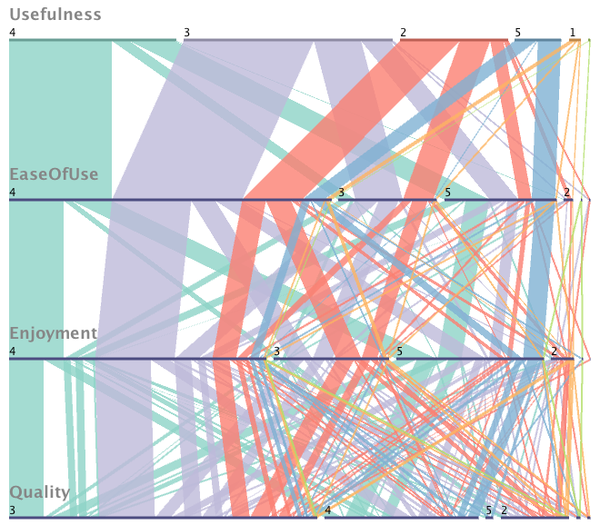
The first four categories, including usefulness, easy of use, enjoyment and quality, are more important, so it it better to check the distribution. The overall response for these four categories are quite good, since most of the participants gave good response. But the response of quality is the worst, and Wiki may need to consider to improve their quality and reliance.
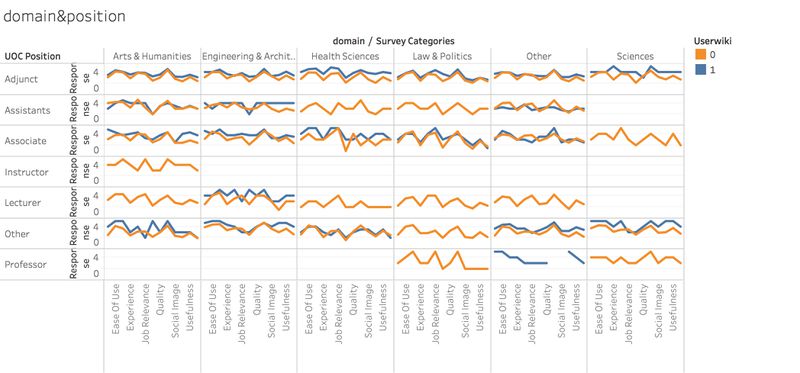
No matter what is the domain or position, the overall response of registered wiki users is better than non-registered users. The trend of different domain and position is similar except for lecturer in Engineering & Architecture domain. They have higher response than others but have a extra low response for user behavior.
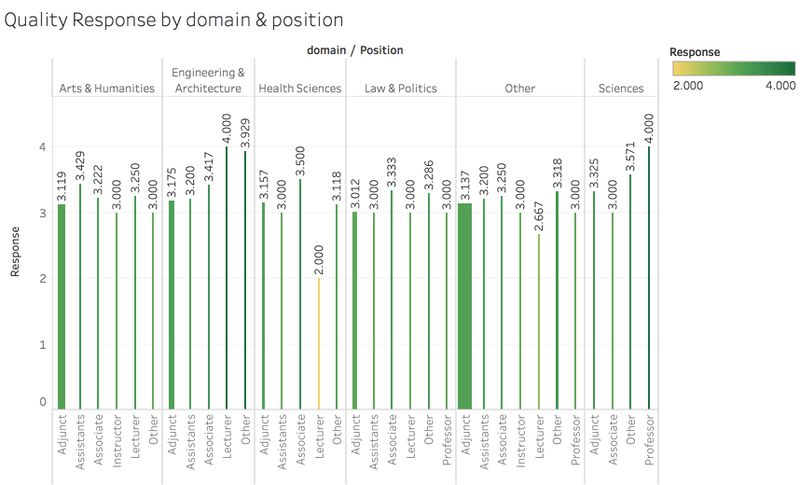
There are totally 13 categories, and we concern about academic quality more, and based on above figure, Wiki perform not so well in quality, so we use quality as a sample. For the other categories, we can easily explore in the Dashboard at category level.
The following chart shows that lecturer in Health Science gave a significant bad feedback in terms of quality.
Question Level
The overall result at question level share the similar patterns with the result at category level. The top5 questions is about the easy of use and sharing attitude.
The responses in different domain are almost the same, except for Law & Politics. The participants in Law & Politics domain gave the worst response for most of the questions.
The below figure shows that instructors and professors have the most dynamic response among all the questions, and it seems that most of instructors have never contributed to Wikipedia. Also, lecturers have almost the worst attitude towards Wikipedia compared with people in other positions.
In order to see the response for each questions, we would like to use treemap to present the result. The detail can be easily check by the dashboard.
Dashboard
- Dashboard at category level [1]
- Dashboard at question level Question Level Dashboard
