Difference between revisions of "ISSS608 2016-17 T1 Assign1 Franky Eddy"
Jump to navigation
Jump to search
| Line 18: | Line 18: | ||
= Results = | = Results = | ||
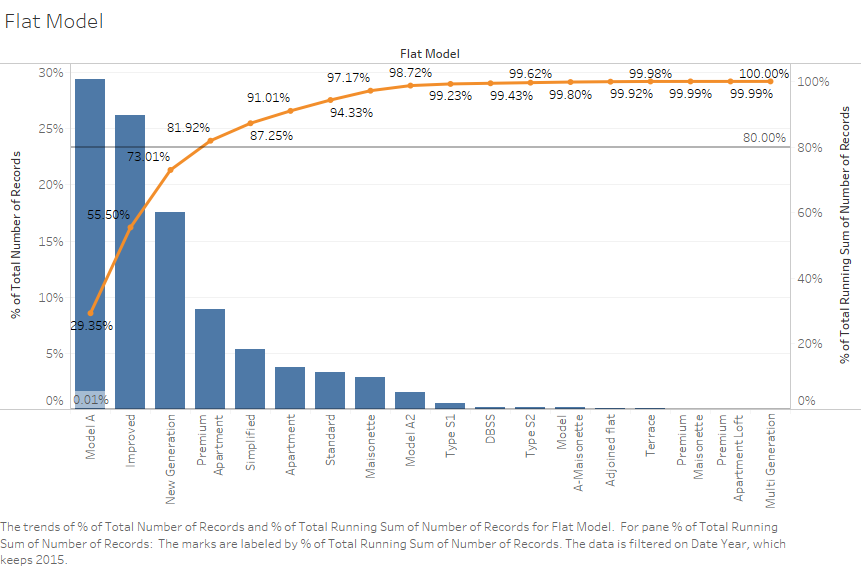
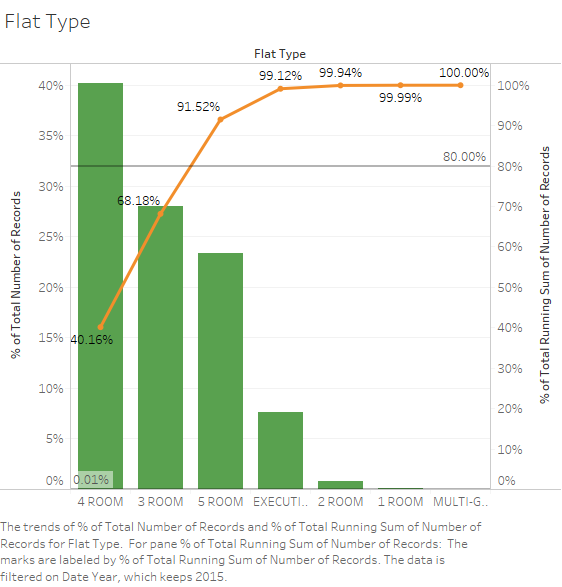
| − | Shares of the resale public housing supply in 2015 | + | == Shares of the resale public housing supply in 2015 == |
=== Flat Model === | === Flat Model === | ||
| Line 28: | Line 28: | ||
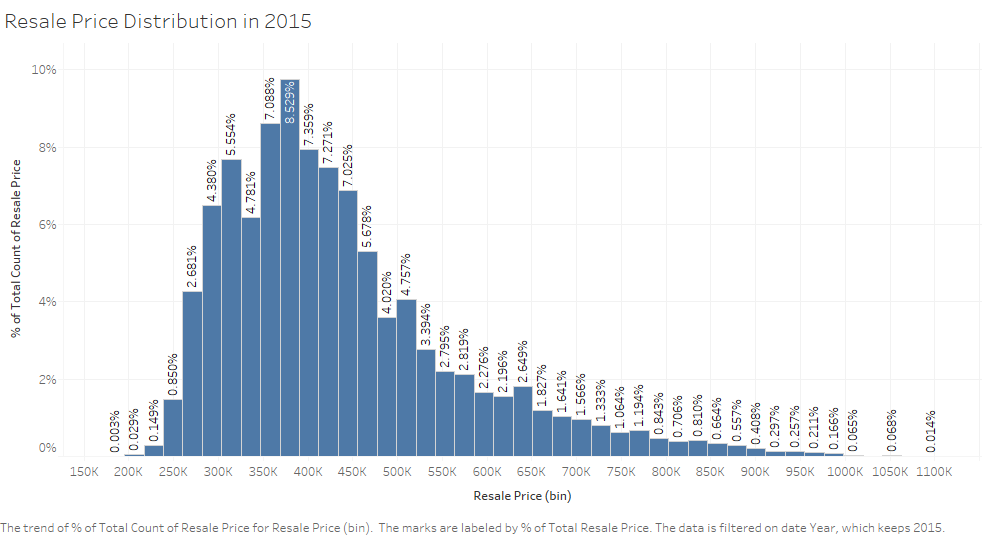
| − | Distribution of the resale public housing prices in 2015 | + | == Distribution of the resale public housing prices in 2015 == |
[[File:Resale Price Distribution in 2015.png]] | [[File:Resale Price Distribution in 2015.png]] | ||
| − | Comparison of the patterns of the first-half of 2016 with the patterns of 2015 | + | == Comparison of the patterns of the first-half of 2016 with the patterns of 2015 == |
Revision as of 19:56, 28 August 2016
Abstract
Abstract
Problem and Motivation
Problem
Approaches
Getting the Data
The first thing to do is getting the data. The data is downloaded from data.gov.sg.
Data Preparation
Analysis
Tools Utilized
The tool used is Tableau 10.0.


