Difference between revisions of "ISSS608 2016-17 T1 Assign2 Aditya Hariharan"
Adityah.2016 (talk | contribs) |
Adityah.2016 (talk | contribs) |
||
| (4 intermediate revisions by the same user not shown) | |||
| Line 43: | Line 43: | ||
[[File:Image 2 8.jpg|720px|thumbnail|right]] | [[File:Image 2 8.jpg|720px|thumbnail|right]] | ||
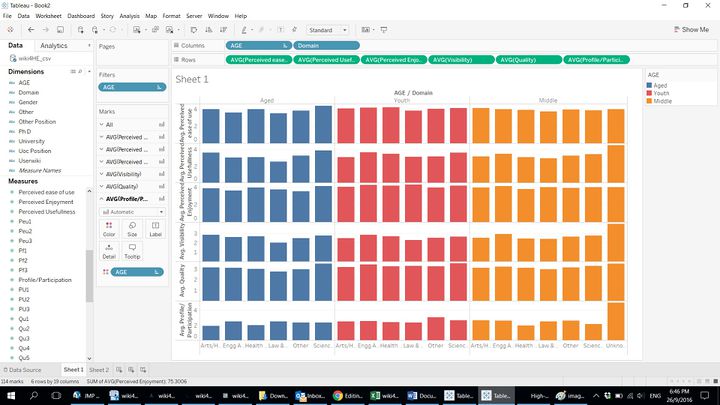
| − | <br>The age range of academics in the survey was seen to be from 23 to 69. The range was consciously divided into 3 categories with 23 to 38 being classified as the "Youth" 39-55 as "middle" and 56-69 as "aged". Scores for each question type according to age were then visually represented as a trellis bar chart. This brought out some interesting inferences. We could see that older people had given a lower score as compared to people from youth or middle age category. This could be because there might have been lesser number of older people in the sample. Another statistic that came to light was that while profile 2.0/Participation scores were marked as low by most people in the sample. One group scored quite high in this area. This was the youthful academics from other domains as well as middle aged academics from unstated/unknown/anonymous domains. | + | <br><br><br><br><br><br><br><br><br><br><br><br><br><br><br><br><br><br><br><br><br>The age range of academics in the survey was seen to be from 23 to 69. The range was consciously divided into 3 categories with 23 to 38 being classified as the "Youth" 39-55 as "middle" and 56-69 as "aged". Scores for each question type according to age were then visually represented as a trellis bar chart. This brought out some interesting inferences. We could see that older people had given a lower score as compared to people from youth or middle age category. This could be because there might have been lesser number of older people in the sample. Another statistic that came to light was that while profile 2.0/Participation scores were marked as low by most people in the sample. One group scored quite high in this area. This was the youthful academics from other domains as well as middle aged academics from unstated/unknown/anonymous domains. |
[[File:Image 2 9.jpg|720px|thumbnail|left]] | [[File:Image 2 9.jpg|720px|thumbnail|left]] | ||
[[File:Image 2 10.jpg|720px|thumbnail|right]] | [[File:Image 2 10.jpg|720px|thumbnail|right]] | ||
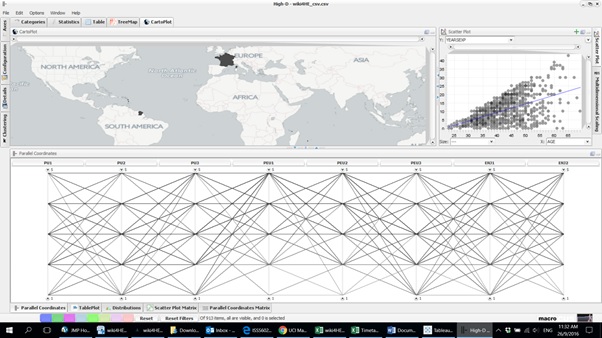
| − | <br>A parallel coordinates plot was constructed using High D to measure patterns of how people have scored the answers in the survey. | + | <br><br><br><br><br><br><br><br><br><br><br><br><br><br><br><br><br><br><br><br><br>A parallel coordinates plot was constructed using High D to measure patterns of how people have scored the answers in the survey. |
[[File:Image 2 11.jpg|720px|thumbnail|center]] | [[File:Image 2 11.jpg|720px|thumbnail|center]] | ||
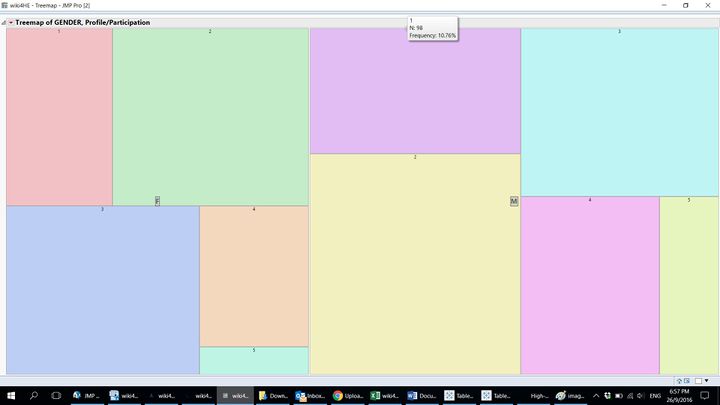
| − | <br>Next based on Gender demographics we check the Profile 2.0/Participation scores and see the frequency and participation in Wikipedia and other online platforms. The Males have projected a slightly higher tendency to participate and this can also be due to a higher male population in the sample. | + | <br>Next based on Gender demographics we check the Profile 2.0/Participation scores and see the frequency and participation in Wikipedia and other online platforms. The Males have projected a slightly higher tendency to participate and this can also be due to a higher male population in the sample. As shown in the treemap below |
[[File:Image 2 12.jpg|720px|thumbnail|center]] | [[File:Image 2 12.jpg|720px|thumbnail|center]] | ||
| + | |||
| + | <br> | ||
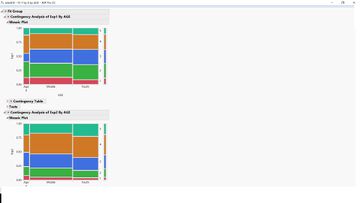
| + | Now we explore how various age groups use wikipedia for what purposes by examining the last set of questions through a mosaic plot. We see that slightly 'aged' or the last age group use wikipedia most for personal issues as well as for academic issues and issues related to their field of expertise while middle aged people use it a lot to work with their students. 'Youth'(ful) academics use it a lot for academic issues and issues related to their field of expertise. Also can be seen is the facrt that very few contribute to wikipedia. | ||
| + | [[File:Image 2 13.jpg|360px|thumbnail|left]] | ||
| + | [[File:Image 2 14.jpg|360px|thumbnail|right]] | ||
| + | [[File:Image 2 15.jpg|360px|thumbnail|centre]] | ||
| + | |||
| + | <br> | ||
| + | Various other insights can be derived from the live tableau dashboard on tableau public where responses according to each question types are grouped. Also filters like UOC Position, University and Gender are included. By playing with these filters and choosing different question types, we can see the trends followed by various groups of users. The dashboard can be reached through the below link<br> https://public.tableau.com/profile/aditya.hariharan#!/vizhome/WikiFinal_0/Dashboard1 | ||
Latest revision as of 19:28, 17 October 2016
Overview
Data is a precious thing and will last longer than the systems themselves.
~ Tim Berners-Lee
The purpose of this assignment is to find and gain certain useful insights with respect to a survey taken among the academia at a university about the usage of wikipedia and various questions regarding its relevance, usefulness and effectiveness as an open platform for learning and discovery. Wikipedia, as we all know, has grown into a worldwide open source of knowledge and information and this analysis seeks to find out what a sample set of academics think about the platform.
Data Set
The Dataset used for the analysis was taken from an online repository https://archive.ics.uci.edu/ml/datasets/wiki4HE which contained information regarding an ongoing research on university faculty perceptions and practices of using Wikipedia as a teaching resource.
wiki4HE dataset
Theme
The purpose of this analysis is to check for various insights related to the dataset chosen and to answer certain questions related to the answers given by the different age, domain and gender demographics within the sample data
Data Preparation
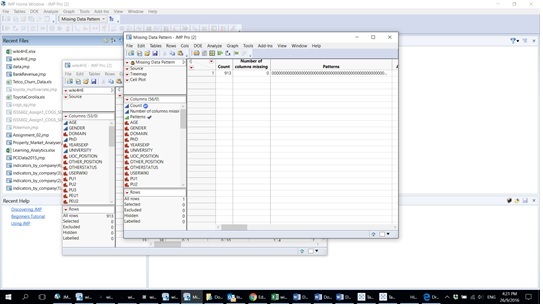
The first step in the data preparation process after loading data from the given excel file is to check for any missing data patterns within the data set
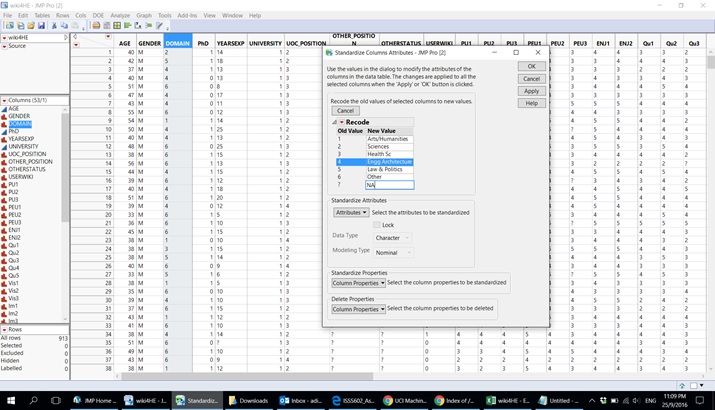
Next we recode various columns in the data for a better understanding according to the meta data provided.
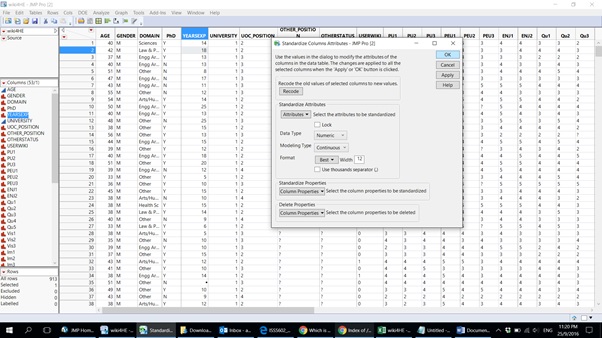
There are certain columns whose data types must be changed for logical purposes. For example 'years of experience' is changed to continuous data while question columns can be changed from categorical to continuous.
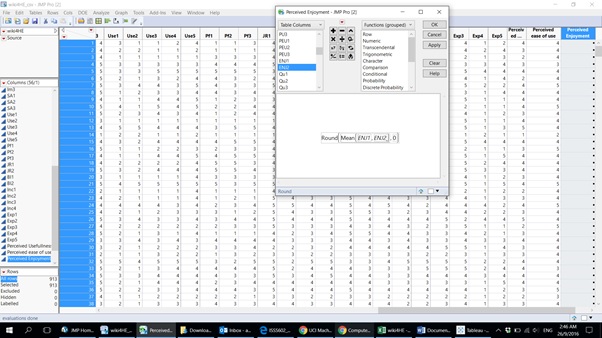
Mean values have been taken for certain question types as new columns but only for question types with questions of similar meanings for whom taking a mean value would be logical.
Data Exploration and Analysis
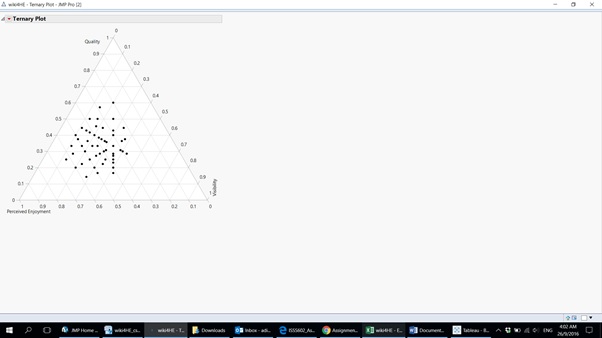
The first inference made is from the ternary plot below which shows the relationship between the perceived quality, perceived visibility and ease of use experienced by the academia within the university.
What we can see from this that the distribution of data is quite highly correlated with most of the data points falling somewhere towards the middle. However a trend that is visible is that there is only one data point whose ease of use score is 1. Thus it can be inferred that everyone within this sample finds wikipedia to be easy to use.
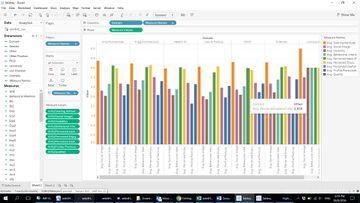
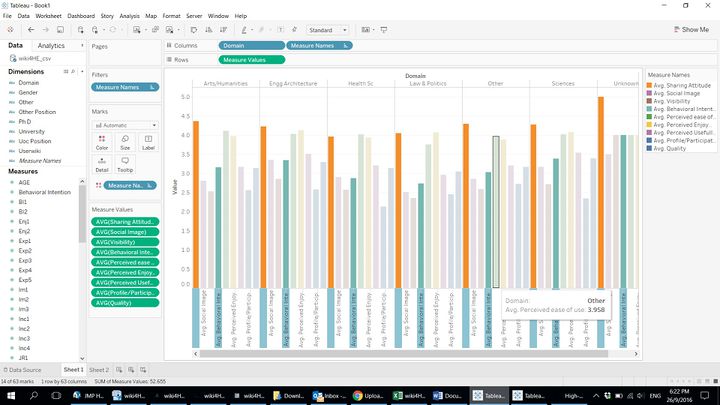
Next a bar graph is constructed by the average of means for every question and is classified domain wise to check how people are using wiki in each domain.
One interesting observation can be deduced from this. We can see that the Behavior Intention and Sharing Attitude have the highest average means across the domains. However the Profile 2.0/Participation in Wikipedia usage is quite low. This means that most of the academics are yet to actively participate in contributing to Wikipedia or other open learning platforms but most have an intention of doing so in the future. This may be because of time constraints or any other constraints such as privacy issues faced by them in their careers or daily life.
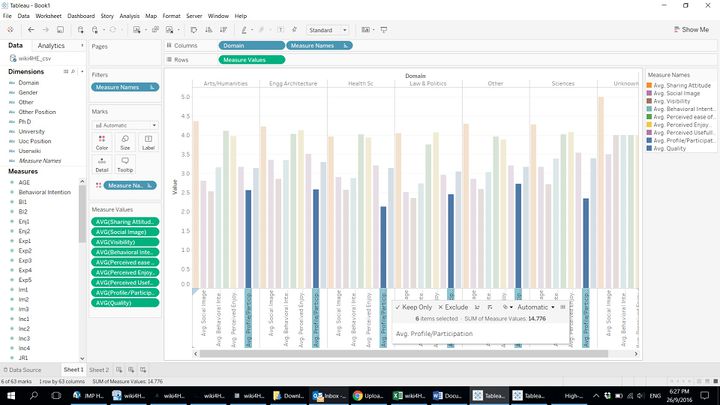
The age range of academics in the survey was seen to be from 23 to 69. The range was consciously divided into 3 categories with 23 to 38 being classified as the "Youth" 39-55 as "middle" and 56-69 as "aged". Scores for each question type according to age were then visually represented as a trellis bar chart. This brought out some interesting inferences. We could see that older people had given a lower score as compared to people from youth or middle age category. This could be because there might have been lesser number of older people in the sample. Another statistic that came to light was that while profile 2.0/Participation scores were marked as low by most people in the sample. One group scored quite high in this area. This was the youthful academics from other domains as well as middle aged academics from unstated/unknown/anonymous domains.
A parallel coordinates plot was constructed using High D to measure patterns of how people have scored the answers in the survey.
Next based on Gender demographics we check the Profile 2.0/Participation scores and see the frequency and participation in Wikipedia and other online platforms. The Males have projected a slightly higher tendency to participate and this can also be due to a higher male population in the sample. As shown in the treemap below
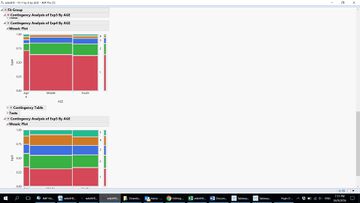
Now we explore how various age groups use wikipedia for what purposes by examining the last set of questions through a mosaic plot. We see that slightly 'aged' or the last age group use wikipedia most for personal issues as well as for academic issues and issues related to their field of expertise while middle aged people use it a lot to work with their students. 'Youth'(ful) academics use it a lot for academic issues and issues related to their field of expertise. Also can be seen is the facrt that very few contribute to wikipedia.
Various other insights can be derived from the live tableau dashboard on tableau public where responses according to each question types are grouped. Also filters like UOC Position, University and Gender are included. By playing with these filters and choosing different question types, we can see the trends followed by various groups of users. The dashboard can be reached through the below link
https://public.tableau.com/profile/aditya.hariharan#!/vizhome/WikiFinal_0/Dashboard1
