Difference between revisions of "ISSS608 2016-17 T1 Assign1 Li Dan"
Dan.li.2015 (talk | contribs) |
Dan.li.2015 (talk | contribs) |
||
| (3 intermediate revisions by the same user not shown) | |||
| Line 1: | Line 1: | ||
| − | [[ISSS608 2016-17 T1 Assign1 Li Dan]] | + | [[ISSS608 2016-17 T1 Assign1 Li Dan]] |
| − | + | ||
| − | |||
=Abstract= | =Abstract= | ||
| − | |||
This project presents the historical HDB resale price index showing a big picture of Singapore public housing resale market, and focuses on analyzing the market condition of 2015 and 2016 to give a general guidance to intended HDB flats buyers. | This project presents the historical HDB resale price index showing a big picture of Singapore public housing resale market, and focuses on analyzing the market condition of 2015 and 2016 to give a general guidance to intended HDB flats buyers. | ||
| − | |||
| − | |||
| − | |||
=Problem and motivation= | =Problem and motivation= | ||
| − | Housing and Development Board (HDB) makes homes affordable to everyone in Singapore. However, if a Singaporean or PR wants to buy HDB flats, the key fact and analysis information is not easily accessible as they spread cross websites such Data.gov.sg, SRX and propertyguru. This report aims to analyze and present key facts and statistic analysis of Singapore public housing resale market, which allows intended HDB flats buyers to gain a general idea of HDB flats resale market condition. | + | Housing and Development Board (HDB) makes homes affordable to everyone in Singapore. However, if a Singaporean or PR wants to buy HDB flats, the key fact and analysis information is not easily accessible as they spread cross websites such Data.gov.sg, SRX and propertyguru. This report aims to analyze and present key facts and statistic analysis of Singapore public housing resale market, which allows intended HDB flats buyers to gain a general idea of HDB flats resale market condition in 2015 and 2016. |
| − | |||
=Tools Utilised= | =Tools Utilised= | ||
| − | Tableau version 10.3 | + | Tableau version 10.3 |
| − | = | + | =The Data= |
| − | * | + | The data sourced from 3 locations: |
| + | *[https://data.gov.sg/dataset/hdb-resale-price-index hdb-resale-price-index] | ||
| + | *[https://data.gov.sg/dataset/resale-flat-prices resale-flat-prices] | ||
| + | *[https://en.wikipedia.org/wiki/Planning_Areas_of_Singapore Planning_Areas_of_Singapore] | ||
| + | After data blending, the data appears as following, with each row representing a HDB resale transaction record. | ||
| + | [[File: DataScreenshot.png|500px|frameless|center]] | ||
| + | |||
| + | =The Big Picture= | ||
| + | == Resale Price Index== | ||
The Resale Price Index (RPI) is an indicator of overall price trend of HDB flats resale market. Previously, RPI is calculated using flat type, flat model as well as location. From 4th quarter of 2014 onwards, the computation method of RPI is modified to further include the attributes of flat structures (storey, height, age) and micro location (closeness to MRT/Plaza). | The Resale Price Index (RPI) is an indicator of overall price trend of HDB flats resale market. Previously, RPI is calculated using flat type, flat model as well as location. From 4th quarter of 2014 onwards, the computation method of RPI is modified to further include the attributes of flat structures (storey, height, age) and micro location (closeness to MRT/Plaza). | ||
| + | For the latest 10 years’ period, HDB RPI saw an increase from 74.9 to 149.4 before 2013 Q2, followed by a slip to 134.7 at 2016 Q1. Though with the drop in recent 3 years, there was an average of 1.6% increase each quarter for the whole plotted period. Also note that the RPI experienced less fluctuation in from 2012 to 2016. | ||
[[File:RPI.png|500px|frameless|center]] | [[File:RPI.png|500px|frameless|center]] | ||
| − | + | ==Treemap== | |
| − | + | The following treemap is created using [https://www.treemap.com/ treemap from Macrofocus]. It has the following attributes: | |
| − | + | ||
| − | + | --Sized by ‘units_sold’ | |
| − | + | ||
| + | --Colored by ‘resale_price’ | ||
| + | |||
| + | --Grouped by ‘region’, ‘town’ ,’flat_type’ | ||
| + | |||
| + | --Labelled by ‘month’, ‘region’, ‘town’,’flat_type’, ‘flat_model’, ‘storey_range’, ‘street_name’, floor_area_sqm’, ‘lease_commence_date’, ‘resale_price’, ‘density (/km2)’ | ||
| + | [[File: Treemap_lidan.png|800px|frameless|center]] | ||
| + | As each small cushion cube represents 1 transaction, each level of detail can be displayed in the treemap as labels. Note that the treemap created using Tableau 10.3 is not able to nicely display details of each resale transaction. This treemap also allows user to interactively filter transactions by all the labels. Though the above screenshot is static picture, one is not hard to observe the insights below. | ||
| + | |||
| + | -'''Insight 1''': Most HDB resale transaction are made in west and north-east region as their rectangle sizes rank top 2. | ||
| + | |||
| + | -'''Insight 2''': The average resale price of ‘4 room’ and ‘5 room’ in west and north-east region is obviously lower than that of central regions where the cubes colours are much darker. | ||
| + | |||
| + | - '''Insight 3''': Among all the towns, Jurong West is where most HDB resale transactions have been made as it shows the top1 rectangle area. | ||
| + | |||
| + | |||
| + | =Questions To Address= | ||
| + | ==What kinds of HDB were re-sold in 2015?== | ||
| + | ===HDB Resale Volume By Flat & Town=== | ||
| + | With the stacked bar chart below, one can observe that, for each town, what were the resale units and proportions in terms of the flat type in 2015. As mentioned in the treemap overview, Jurong west was the most popular town where HDB resale happened in 2015. Besides, 3-room and 4-room is notably highly demanded in 2015. | ||
| + | [[File: Resale Volume By Flat & Town.png|700px|frameless|center]] | ||
| + | |||
| + | |||
| + | ===HDB Age by Town=== | ||
| + | Following boxplots shows the age spread of each HDB re-sold in 2015 by region and town location. Each point represents the age of HDB of 1 transaction. It is observed that age of HDB in Buikit Merah and Jurong West hold a big range from 2 years to 45+ years. While for Pungol and Sembawang, the HDB flats resold in 2015 were quite new, with all of them aging less than 20 years. | ||
| + | [[File: HDB Age by Town .png|700px|frameless|center]] | ||
| + | |||
| + | |||
| + | |||
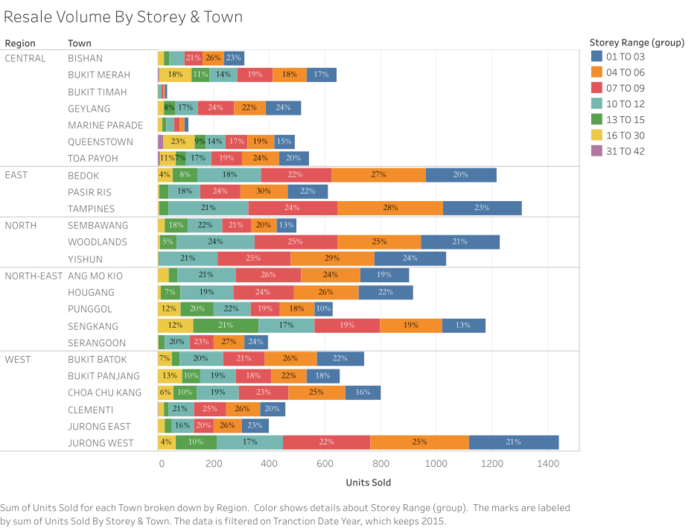
| + | ===HDB Resale Volume By Storey & Town=== | ||
| + | The stacked bar chart bellow shows that, for each town, what were the resale units and proportions in terms of the storey range in 2015. It’s seen that HDB at floor less than 12 were transacted most, while in central region the proportion transaction of HDB resale volume was notably higher in 2015. | ||
| + | [[File: Resale Volume By Storey & Town.png|700px|frameless|center]] | ||
| + | ==What were the resale prices of HDB in 2015?== | ||
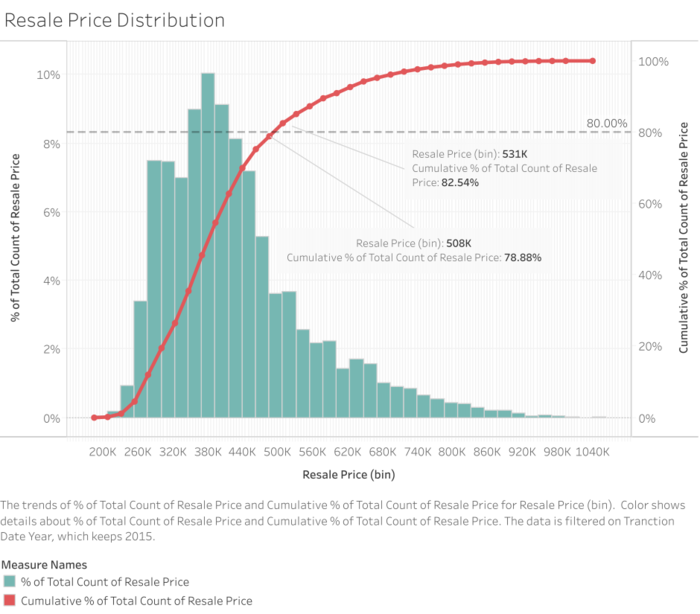
| + | ===80% HDB re-sold below 513k in 2015=== | ||
| + | The histogram displays the distribution of resale price in 2015. The red line is the cumulative percentage of Total resale volume which measured by the secondary axis. It shows that cumulative 80% sales fall between 508K to 531K. if the bin size of histogram is smaller, it can be observed that 80% of HDB resale transaction made below the price of 513K in 2015. | ||
| + | [[File: 80% HDB re-sold below 513k.png|700px|frameless|center]] | ||
| + | |||
| + | |||
| − | + | ===Resale Price Per Sqm by Town=== | |
| − | + | The following horizontal boxplots illustrates the distribution of resale prices per m^2 (Sqm) for each transaction in different towns in 2015. It says that, in towns of central region, while compared with towns in other regions, less HDB resale transactions has been made in 2015. Though with the relative small tranction volume, towns in central region experienced relative higher median resale price per Sqm and higher fluctuation of resale price per Sqm in 2015, as their boxplots lies more in the right hand side of the chart and they are relatively long. | |
| − | [[File: | + | [[File: Resale Price Per Sqm by Town .png|700px|frameless|center]] |
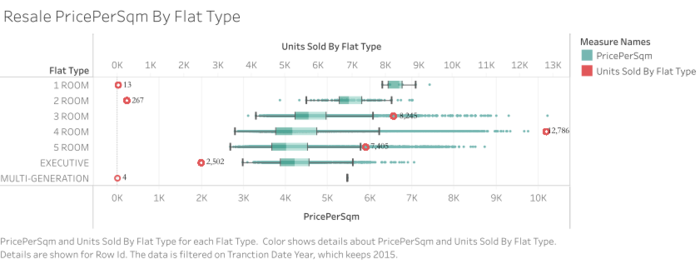
| + | ===Resale PricePerSqm By Flat Type=== | ||
| + | The following horizontal boxplots illustrates the distribution of resale prices per m^2 (Sqm) of each transaction for different flat types in 2015. Surprisingly, though with a smaller flat size, the 3-room and 4-room flats in 2015, as compared with 5-room and Executive flats, were seen higher median prices per Sqm and high transaction resale prices per Sqm shown long tails beyond their upper whiskers. | ||
| + | [[File: Flat Size.png|700px|frameless|center]] | ||
| + | [[File: Resale PricePerSqm By Flat Type.png|700px|frameless|center]] | ||
| − | |||
| − | + | ==What is the trend of HDB resale market in 2016 as compared with 2015?== | |
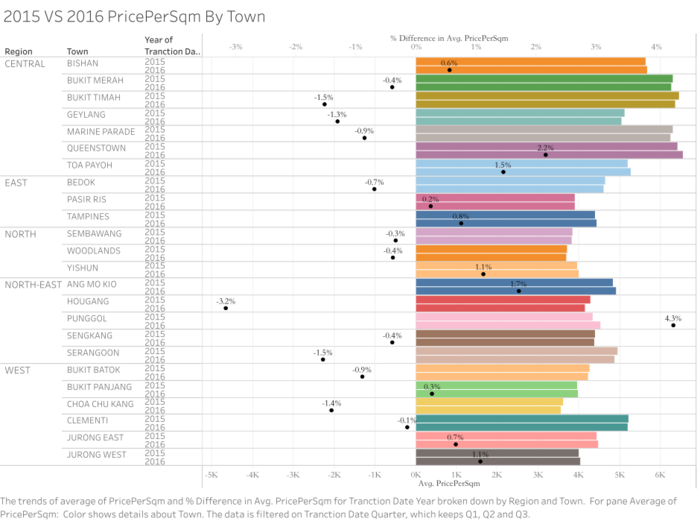
| − | [[File: | + | ===2015 VS 2016 PricePerSqm By Town=== |
| − | + | [[File: 2015 VS 2016 PricePerSqm By Town.png|700px|frameless|center]] | |
| − | + | ===2015 VS 2016 Sales Volume By Town=== | |
| − | + | [[File: 2015 VS 2016 Sales Volume By Town.png|700px|frameless|center]] | |
| − | [[File: | ||
| − | |||
| − | |||
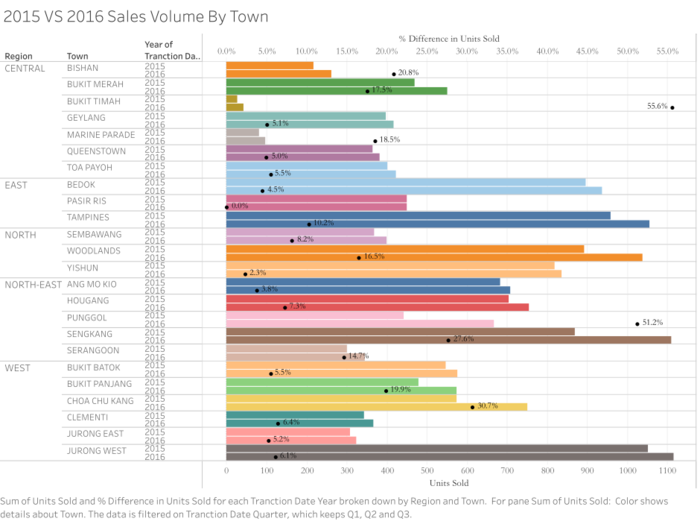
| − | + | With the 2 chart above, it is observed that in first 3Q of 2016 as compared to the same period in 2015, there has been some ups and downs of average HDB resale price for different towns while the HDB resale volume kept increasing for all towns. | |
| − | |||
| − | |||
| − | |||
| − | + | Notably, PUNGGOL, from the north-east region, has experienced a surge of HDB resale price of 4.3% from 4343 to 4529 SGD per Sqm, ranking as the top1 growth rate. This can be explained by the 51.2% surge on the sales volume in the first 3 quarter of 2016 as compared with the same period in 2015. HOUGANG on the other hand, its HDB resale price, from 2015 to 2016, dropped 3.2% from 4290 to 4154 SGD per Sqm for the first 3 quarters, ranking as the top1 negative growth rate. While the HDB resale supplied in Hougang increased 7.3%. | |
| − | |||
| − | |||
| − | |||
| − | |||
| − | + | =Infographic= | |
| − | = | + | [[File: Info.png|700px|frameless|center]] |
| − | |||
Latest revision as of 18:00, 17 October 2016
ISSS608 2016-17 T1 Assign1 Li Dan
Contents
Abstract
This project presents the historical HDB resale price index showing a big picture of Singapore public housing resale market, and focuses on analyzing the market condition of 2015 and 2016 to give a general guidance to intended HDB flats buyers.
Problem and motivation
Housing and Development Board (HDB) makes homes affordable to everyone in Singapore. However, if a Singaporean or PR wants to buy HDB flats, the key fact and analysis information is not easily accessible as they spread cross websites such Data.gov.sg, SRX and propertyguru. This report aims to analyze and present key facts and statistic analysis of Singapore public housing resale market, which allows intended HDB flats buyers to gain a general idea of HDB flats resale market condition in 2015 and 2016.
Tools Utilised
Tableau version 10.3
The Data
The data sourced from 3 locations:
After data blending, the data appears as following, with each row representing a HDB resale transaction record.
The Big Picture
Resale Price Index
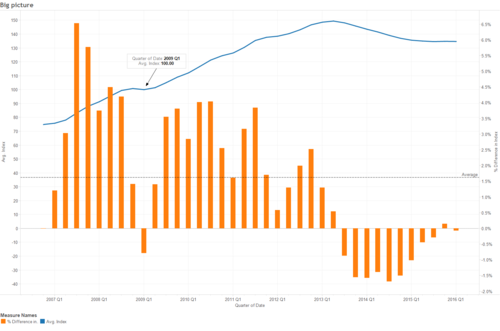
The Resale Price Index (RPI) is an indicator of overall price trend of HDB flats resale market. Previously, RPI is calculated using flat type, flat model as well as location. From 4th quarter of 2014 onwards, the computation method of RPI is modified to further include the attributes of flat structures (storey, height, age) and micro location (closeness to MRT/Plaza). For the latest 10 years’ period, HDB RPI saw an increase from 74.9 to 149.4 before 2013 Q2, followed by a slip to 134.7 at 2016 Q1. Though with the drop in recent 3 years, there was an average of 1.6% increase each quarter for the whole plotted period. Also note that the RPI experienced less fluctuation in from 2012 to 2016.
Treemap
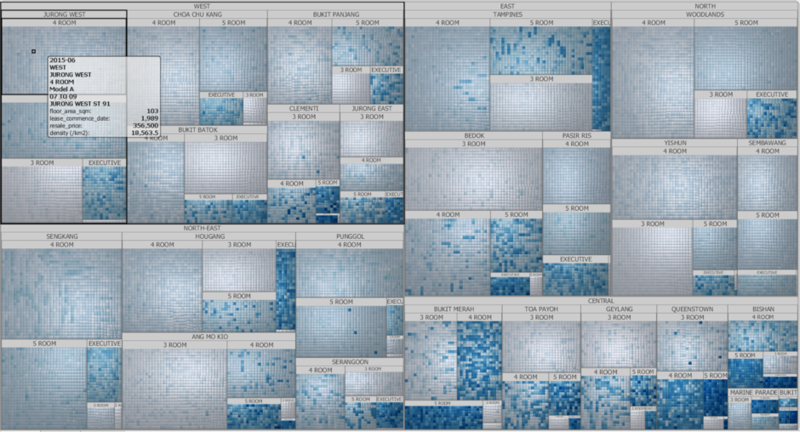
The following treemap is created using treemap from Macrofocus. It has the following attributes:
--Sized by ‘units_sold’
--Colored by ‘resale_price’
--Grouped by ‘region’, ‘town’ ,’flat_type’
--Labelled by ‘month’, ‘region’, ‘town’,’flat_type’, ‘flat_model’, ‘storey_range’, ‘street_name’, floor_area_sqm’, ‘lease_commence_date’, ‘resale_price’, ‘density (/km2)’
As each small cushion cube represents 1 transaction, each level of detail can be displayed in the treemap as labels. Note that the treemap created using Tableau 10.3 is not able to nicely display details of each resale transaction. This treemap also allows user to interactively filter transactions by all the labels. Though the above screenshot is static picture, one is not hard to observe the insights below.
-Insight 1: Most HDB resale transaction are made in west and north-east region as their rectangle sizes rank top 2.
-Insight 2: The average resale price of ‘4 room’ and ‘5 room’ in west and north-east region is obviously lower than that of central regions where the cubes colours are much darker.
- Insight 3: Among all the towns, Jurong West is where most HDB resale transactions have been made as it shows the top1 rectangle area.
Questions To Address
What kinds of HDB were re-sold in 2015?
HDB Resale Volume By Flat & Town
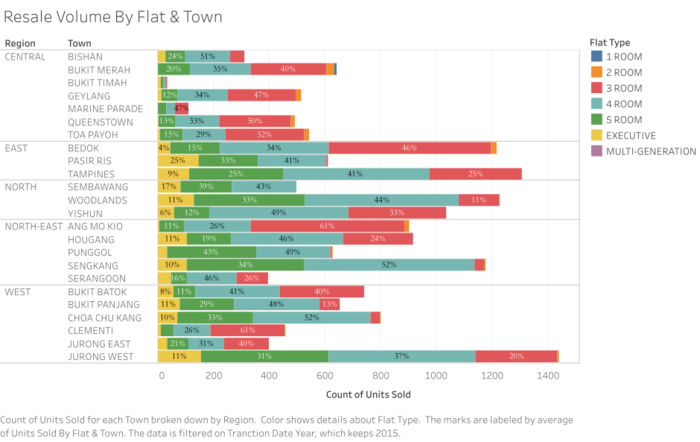
With the stacked bar chart below, one can observe that, for each town, what were the resale units and proportions in terms of the flat type in 2015. As mentioned in the treemap overview, Jurong west was the most popular town where HDB resale happened in 2015. Besides, 3-room and 4-room is notably highly demanded in 2015.
HDB Age by Town
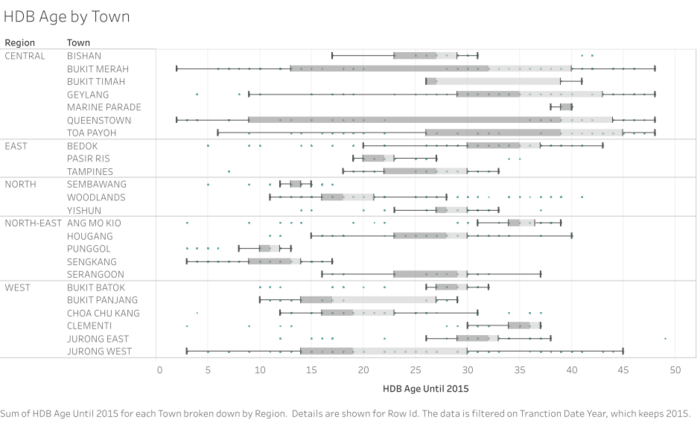
Following boxplots shows the age spread of each HDB re-sold in 2015 by region and town location. Each point represents the age of HDB of 1 transaction. It is observed that age of HDB in Buikit Merah and Jurong West hold a big range from 2 years to 45+ years. While for Pungol and Sembawang, the HDB flats resold in 2015 were quite new, with all of them aging less than 20 years.
HDB Resale Volume By Storey & Town
The stacked bar chart bellow shows that, for each town, what were the resale units and proportions in terms of the storey range in 2015. It’s seen that HDB at floor less than 12 were transacted most, while in central region the proportion transaction of HDB resale volume was notably higher in 2015.
What were the resale prices of HDB in 2015?
80% HDB re-sold below 513k in 2015
The histogram displays the distribution of resale price in 2015. The red line is the cumulative percentage of Total resale volume which measured by the secondary axis. It shows that cumulative 80% sales fall between 508K to 531K. if the bin size of histogram is smaller, it can be observed that 80% of HDB resale transaction made below the price of 513K in 2015.
Resale Price Per Sqm by Town
The following horizontal boxplots illustrates the distribution of resale prices per m^2 (Sqm) for each transaction in different towns in 2015. It says that, in towns of central region, while compared with towns in other regions, less HDB resale transactions has been made in 2015. Though with the relative small tranction volume, towns in central region experienced relative higher median resale price per Sqm and higher fluctuation of resale price per Sqm in 2015, as their boxplots lies more in the right hand side of the chart and they are relatively long.
Resale PricePerSqm By Flat Type
The following horizontal boxplots illustrates the distribution of resale prices per m^2 (Sqm) of each transaction for different flat types in 2015. Surprisingly, though with a smaller flat size, the 3-room and 4-room flats in 2015, as compared with 5-room and Executive flats, were seen higher median prices per Sqm and high transaction resale prices per Sqm shown long tails beyond their upper whiskers.
What is the trend of HDB resale market in 2016 as compared with 2015?
2015 VS 2016 PricePerSqm By Town
2015 VS 2016 Sales Volume By Town
With the 2 chart above, it is observed that in first 3Q of 2016 as compared to the same period in 2015, there has been some ups and downs of average HDB resale price for different towns while the HDB resale volume kept increasing for all towns.
Notably, PUNGGOL, from the north-east region, has experienced a surge of HDB resale price of 4.3% from 4343 to 4529 SGD per Sqm, ranking as the top1 growth rate. This can be explained by the 51.2% surge on the sales volume in the first 3 quarter of 2016 as compared with the same period in 2015. HOUGANG on the other hand, its HDB resale price, from 2015 to 2016, dropped 3.2% from 4290 to 4154 SGD per Sqm for the first 3 quarters, ranking as the top1 negative growth rate. While the HDB resale supplied in Hougang increased 7.3%.

