Difference between revisions of "ISSS608 2016-17 T1 Assign2 Franky Eddy"
(Created page with " Abstract = Wiki is * What are the shares of resale public housing supply? * How is the distribution of resale public housing prices? * How is the comparison between patterns...") |
|||
| (66 intermediate revisions by the same user not shown) | |||
| Line 1: | Line 1: | ||
| − | + | = Abstract = | |
| − | + | Nowadays, internet has been one of the most popularly used technology to explore and find useful information. Wikipedia is one of the most commonly used source for studying as well as teaching resource.From the survey data of faculty members from two Spanish universities on teaching uses of Wikipedia, there are some insights and findings that wanted to be explored: | |
| − | + | * How do respondents with different age groups rate their experience on using Wikipedia? | |
| − | |||
| − | * How | ||
| − | + | * What is the rating (Likert Value) of each question or statement used in the survey? | |
| − | |||
| − | |||
| − | |||
| + | * How do respondents with different gender from different universities, domains, and age group rate their experience on using Wikipedia? | ||
| + | * How do universities, domain, or Wikiuser rate their contribution to Wikipedia? | ||
| − | + | To answer these questions, data visualization is used to get insights: | |
| − | + | * Most of the respondents aged 20-30 tends to rate higher (Strongly Agree and Agree) on their experience using Wikipedia compared to other age groups | |
| − | + | * Respondents from age group of 60 years old and above respond "Neutral" on their experience using Wikipedia more than other age groups | |
| + | * Respondents used Wikipedia as a reference for their academic related issues but not citing Wikipedia in their academic papers | ||
| + | * Respondents from UPF are on both extremes (very high and very low) in terms of Likert Value rating that they give on the survey | ||
| + | * Wiki users tends to rate the survey higher than non-Wiki users rate | ||
| − | + | <br /> | |
| − | |||
| − | |||
| + | = Overview of Data = | ||
| + | The dataset used is the survey of faculty members from two Spanish universities on teaching uses of Wikipedia. | ||
= Approaches = | = Approaches = | ||
| + | The step by step approaches done can be seen below. | ||
| + | <br /> | ||
| + | ==Step 1: Identify a theme of interest== | ||
| + | The wiki dataset consists of answers from survey for research on university faculty perceptions and practices of using Wikipedia as a teaching resource. Theme of interest that can be explored from the dataset is the relationship between different attributes of the respondents and how they assess based on the survey. | ||
| − | == | + | ==Step 2: Define questions for investigation== |
| − | |||
| − | |||
| − | |||
| − | |||
| − | |||
| − | |||
| − | |||
| − | |||
| − | |||
| − | = | ||
| − | |||
| + | There are 4 questions that will be investigated based on the theme of interests defined: | ||
| − | + | * How do respondents with different age groups rate their experience on using Wikipedia? | |
| − | |||
| − | |||
| − | |||
| − | |||
| − | |||
| − | |||
| − | |||
| − | |||
| − | |||
| − | |||
| − | |||
| − | |||
| − | |||
| − | |||
| − | |||
| − | |||
| − | |||
| − | |||
| − | |||
| − | |||
| − | |||
| − | |||
| − | |||
| − | |||
| − | |||
| − | |||
| − | |||
| − | |||
| − | |||
| − | |||
| − | |||
| − | |||
| − | |||
| − | |||
| − | |||
| − | |||
| − | |||
| − | |||
| − | |||
| − | |||
| − | |||
| − | |||
| − | |||
| − | |||
| − | |||
| − | |||
| − | |||
| − | |||
| − | |||
| − | |||
| − | |||
| − | |||
| − | + | * What is the rating (Likert Value) of each question or statement used in the survey? | |
| + | * How do respondents with different gender from different universities, domains, and age group rate their experience on using Wikipedia? | ||
| − | + | * How do universities, domain, or Wikiuser rate their contribution to Wikipedia? | |
| − | + | ==Step 3: Find appropriate data attributes== | |
| + | After defining the questions, the next step is finding the appropriate data attributes. The data attributes that will be used are University, Domain, Gender, and UserWiki. These attributes will be used to analyse the survey results and see whether there are some insights that can be obtained. | ||
| − | |||
| − | = | + | === Data Preparation === |
| − | + | Before using the data to do analysis, firstly data preparation needs to be done. | |
| − | + | The first thing to be done is recoding all "?" values to blank values. | |
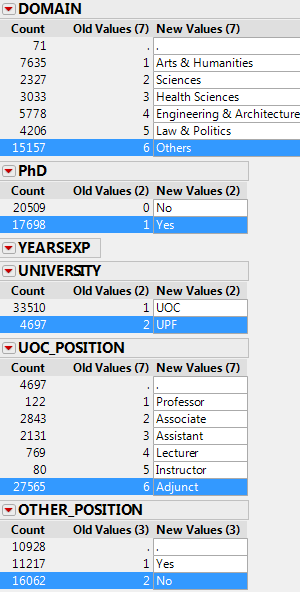
| − | + | After that, other variables such as Gender, Domain, PhD, YearsExp, University, UOC_Position, Other Position, OtherStatus, and UserWiki are also recoded as can be seen in the figure below. | |
| − | |||
| − | |||
| − | + | [[File:Recode Franky.png]] | |
| − | |||
| − | |||
| − | |||
| + | After recoding the variable values, next, a new column named "ID" is created to be assigned to each respondents. This is done to help in visualizing the data. | ||
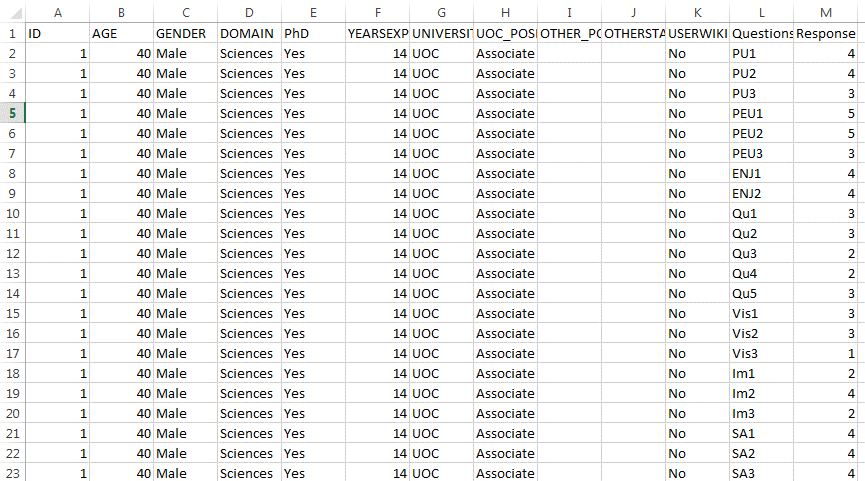
| + | <br /> After adding a new column "ID", next the dataset needs to be reshaped so that every question has one row. The reshaped data can be seen in the figure below. | ||
| + | [[File:Reshape Franky.png]] | ||
| + | <br /> | ||
| + | <br /> | ||
| + | After reshaping the data, the data is now ready to be used for analysis. | ||
| + | <br /> | ||
| + | Lastly, the Question code (e.g. PU1,PU2,PU3) needs to be changed to the actual question by changing the alias so that it is more meaningful in the visualization. | ||
| + | <br /> | ||
| − | = | + | = Analysis = |
| − | + | After preparing the data, next step is to do the analysis. The analysis is done to answer the questions that have been defined. | |
| − | The | ||
| − | + | == Results == | |
| − | + | There are 3 results from the analysis: | |
| − | + | <br /> | |
| + | [[File:Age Group Responses Franky.png]] | ||
| + | <br /> | ||
| + | <br /> | ||
| + | <br /> | ||
| + | From the graph, there are few interesting observations can be observed. First, it can be seen that most of the respondents aged 20-30 tends to rate higher (Strongly Agree and Agree) for the statement "I consult Wikipedia for personal issues" (about 75%) compared to other age groups. Another interesting observation from this chart is that respondents from age group of 60 years old and above respond "Neutral" to this statement more than other age groups. The overall distribution of the response for this question is relatively skewed to "Agree". Respondents aged between 30 and 60 have relatively similar distribution with most of the respondents respond "Agree" to this statement. | ||
| + | . | ||
| + | <br /> | ||
| + | <br /> | ||
| + | <br /> | ||
| + | [[File:Likert Franky.png]] | ||
| + | <br /> | ||
| + | <br /> | ||
| + | From this chart, it can be seen that the statement "I consult Wikipedia for personal issues" have the highest rating (3.651) compared to 5 other statements while citing Wikipedia in academic papers has the lowest Rating (2.027) compared to the 5 other statements. Another statement that also have relatively high rating (3.492) is "I consult Wikipedia for academic related issues". This also indicates that most of the respondents used Wikipedia as a reference for their academic related issues but they will usually decide not to cite Wikipedia in their academic papers. | ||
| + | <br /> | ||
| + | <br /> | ||
| − | = | + | [[File:Treemap Franky.png]] |
| + | <br /> | ||
| + | <br /> | ||
| + | From the Treemap plot, it can be seen that most of the respondents are from UOC and "Others" domain. It can also be seen from the plot that respondents from UPF are on both extremes (very high and very low) in terms of Likert Value rating. This can be seen from the bottom right side of the Treemap Plot where the University and Domain of the respondent are same but there is a very high (darker color) Likert Value rating, and there is also a very low (light color) Likert value rating. | ||
| + | <br /> | ||
| + | <br /> | ||
| + | [[File:Trellis Franky.png]] | ||
| + | <br /> | ||
| + | <br /> | ||
| + | From the trellis chart above, it can be seen that there is a distinct difference in Likert Value rating between Wiki user and Non-wiki user. Wiki users tends to rate higher (average Likert value >2) than non-Wiki users rate (average Likert value <=1.5).This is probably because Wiki users are more used to using it and therefore understand the advantage of Wikipedia better which leads to higher rating on the survey. Another interesting thing can be observed from this graph is that respondents from UOC are on both extremes (highest and lowest) in terms of average likert value. | ||
| + | <br /> | ||
| + | <br /> | ||
| − | + | [[File:Question Group.png]] | |
| − | + | <br /> | |
| − | + | <br /> | |
| − | + | From this chart, it can be seen that most of the respondents rated high (average Likert value = 4.235) for "Sharing Attitude" questions while they rated relatively lower (average Likert value <= 2.5) for "Profile" and "Use Behavior" questions. This indicates that most of the respondents realized that it is important for them to share and publish academic content and research results in online platform such as Wikipedia but they are unlikely to participate actively or recommend their students and colleagues to use Wikipedia. | |
| − | + | <br /> | |
| − | + | <br /> | |
| − | = | + | = Interactive Visualization = |
| − | + | These are the links to the Tableau Public : <br />Dashboard 1 [https://public.tableau.com/profile/franky.eddy#!/vizhome/Dashboard1Updated_Franky/Dashboard1] | |
| + | <br /> | ||
| + | Dashboard 2[https://public.tableau.com/profile/franky.eddy#!/vizhome/Dashboard2_Franky/Dashboard2] | ||
= Tools Utilized = | = Tools Utilized = | ||
| − | The | + | The tools used for this analysis are Tableau 10.0, JMP Pro12, and Microsoft Excel, Tableau Public. |
| − | + | <br /> | |
| − | + | * Tableau 10.0 is used to visualize the data. | |
| − | + | * JMP Pro12 is used to clean and prepare the data before it can be used for further analysis. | |
| − | + | * Microsoft Excel is used to clean and reshape the data so that it will be easier to visualize. | |
| − | + | * Tableau Public is used to enable interactive visualization of the charts. | |
| − | + | <br /> | |
| − | |||
| − | |||
| − | |||
| − | |||
| − | |||
| − | |||
| − | |||
| − | |||
| − | |||
| − | |||
| − | |||
| − | |||
| − | |||
| − | |||
| − | |||
| − | |||
| − | |||
| − | |||
| − | |||
| − | |||
| − | |||
| − | |||
| − | |||
| − | |||
| − | |||
| − | |||
| − | |||
| − | |||
| − | |||
| − | |||
| − | |||
| − | |||
| − | |||
| − | |||
| − | |||
| − | |||
| − | |||
| − | |||
| − | |||
| − | |||
| − | |||
| − | |||
| − | |||
| − | |||
| + | Charts used: Bar Chart, Stacked bar Chart, Treemap, Trellis Chart | ||
| − | + | <br /> | |
| − | |||
| + | =References= | ||
| + | Below are some of the references that are used as a guide:<br /> | ||
| + | http://www.datarevelations.com/using-tableau-to-visualize-survey-data-part-1.html<br /> | ||
| + | http://www.datarevelations.com/using-tableau-to-visualize-survey-data-part-2.html<br /> | ||
| − | |||
= Comments = | = Comments = | ||
Latest revision as of 00:39, 10 October 2016
Contents
Abstract
Nowadays, internet has been one of the most popularly used technology to explore and find useful information. Wikipedia is one of the most commonly used source for studying as well as teaching resource.From the survey data of faculty members from two Spanish universities on teaching uses of Wikipedia, there are some insights and findings that wanted to be explored:
- How do respondents with different age groups rate their experience on using Wikipedia?
- What is the rating (Likert Value) of each question or statement used in the survey?
- How do respondents with different gender from different universities, domains, and age group rate their experience on using Wikipedia?
- How do universities, domain, or Wikiuser rate their contribution to Wikipedia?
To answer these questions, data visualization is used to get insights:
- Most of the respondents aged 20-30 tends to rate higher (Strongly Agree and Agree) on their experience using Wikipedia compared to other age groups
- Respondents from age group of 60 years old and above respond "Neutral" on their experience using Wikipedia more than other age groups
- Respondents used Wikipedia as a reference for their academic related issues but not citing Wikipedia in their academic papers
- Respondents from UPF are on both extremes (very high and very low) in terms of Likert Value rating that they give on the survey
- Wiki users tends to rate the survey higher than non-Wiki users rate
Overview of Data
The dataset used is the survey of faculty members from two Spanish universities on teaching uses of Wikipedia.
Approaches
The step by step approaches done can be seen below.
Step 1: Identify a theme of interest
The wiki dataset consists of answers from survey for research on university faculty perceptions and practices of using Wikipedia as a teaching resource. Theme of interest that can be explored from the dataset is the relationship between different attributes of the respondents and how they assess based on the survey.
Step 2: Define questions for investigation
There are 4 questions that will be investigated based on the theme of interests defined:
- How do respondents with different age groups rate their experience on using Wikipedia?
- What is the rating (Likert Value) of each question or statement used in the survey?
- How do respondents with different gender from different universities, domains, and age group rate their experience on using Wikipedia?
- How do universities, domain, or Wikiuser rate their contribution to Wikipedia?
Step 3: Find appropriate data attributes
After defining the questions, the next step is finding the appropriate data attributes. The data attributes that will be used are University, Domain, Gender, and UserWiki. These attributes will be used to analyse the survey results and see whether there are some insights that can be obtained.
Data Preparation
Before using the data to do analysis, firstly data preparation needs to be done. The first thing to be done is recoding all "?" values to blank values. After that, other variables such as Gender, Domain, PhD, YearsExp, University, UOC_Position, Other Position, OtherStatus, and UserWiki are also recoded as can be seen in the figure below.
After recoding the variable values, next, a new column named "ID" is created to be assigned to each respondents. This is done to help in visualizing the data.
After adding a new column "ID", next the dataset needs to be reshaped so that every question has one row. The reshaped data can be seen in the figure below.
After reshaping the data, the data is now ready to be used for analysis.
Lastly, the Question code (e.g. PU1,PU2,PU3) needs to be changed to the actual question by changing the alias so that it is more meaningful in the visualization.
Analysis
After preparing the data, next step is to do the analysis. The analysis is done to answer the questions that have been defined.
Results
There are 3 results from the analysis:
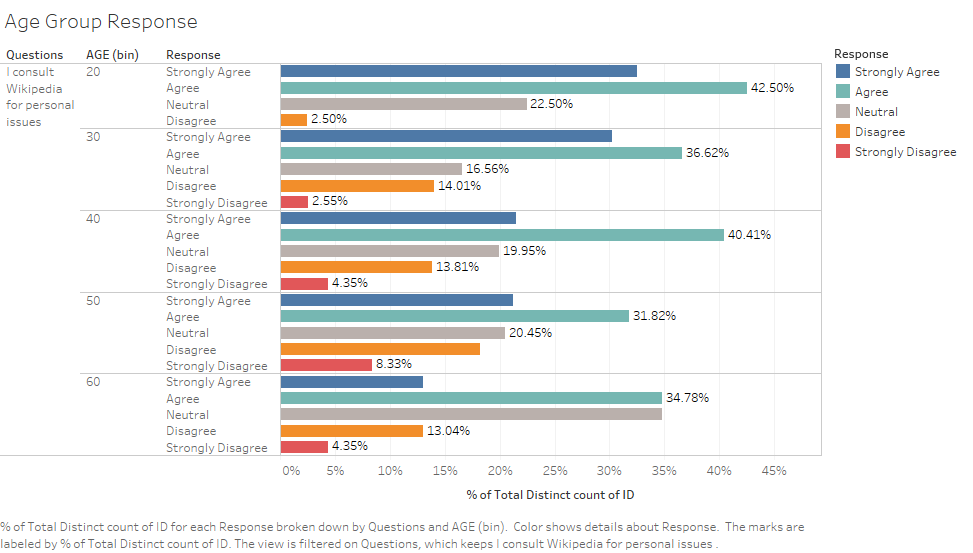
From the graph, there are few interesting observations can be observed. First, it can be seen that most of the respondents aged 20-30 tends to rate higher (Strongly Agree and Agree) for the statement "I consult Wikipedia for personal issues" (about 75%) compared to other age groups. Another interesting observation from this chart is that respondents from age group of 60 years old and above respond "Neutral" to this statement more than other age groups. The overall distribution of the response for this question is relatively skewed to "Agree". Respondents aged between 30 and 60 have relatively similar distribution with most of the respondents respond "Agree" to this statement.
.
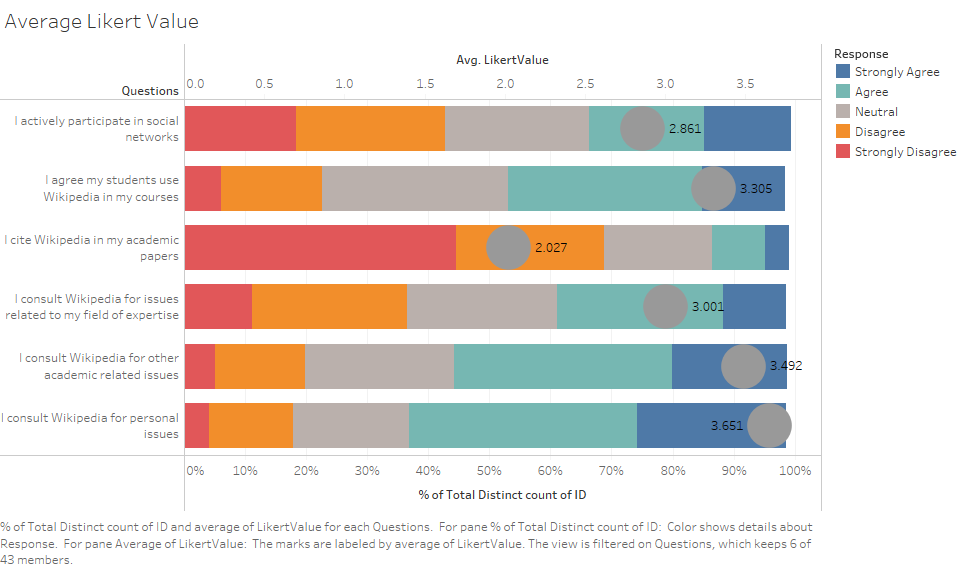
From this chart, it can be seen that the statement "I consult Wikipedia for personal issues" have the highest rating (3.651) compared to 5 other statements while citing Wikipedia in academic papers has the lowest Rating (2.027) compared to the 5 other statements. Another statement that also have relatively high rating (3.492) is "I consult Wikipedia for academic related issues". This also indicates that most of the respondents used Wikipedia as a reference for their academic related issues but they will usually decide not to cite Wikipedia in their academic papers.
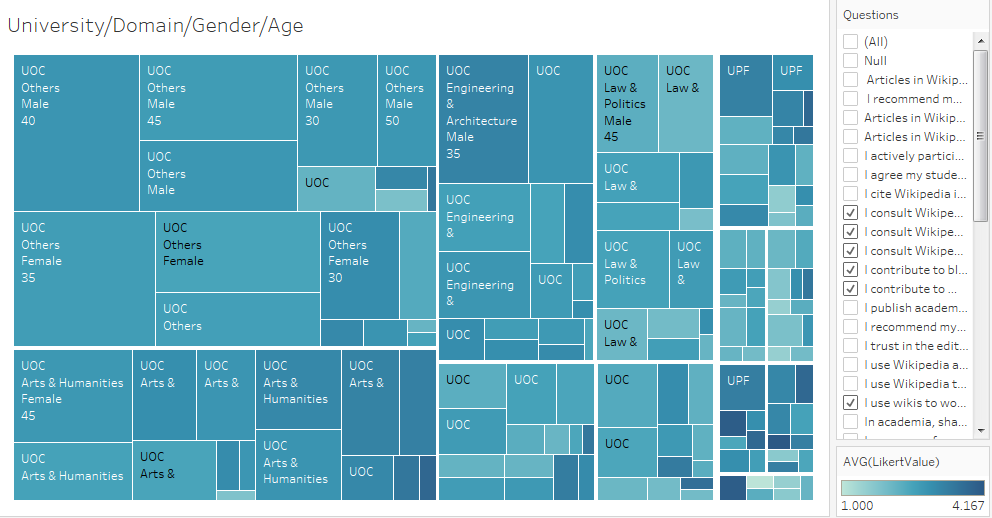
From the Treemap plot, it can be seen that most of the respondents are from UOC and "Others" domain. It can also be seen from the plot that respondents from UPF are on both extremes (very high and very low) in terms of Likert Value rating. This can be seen from the bottom right side of the Treemap Plot where the University and Domain of the respondent are same but there is a very high (darker color) Likert Value rating, and there is also a very low (light color) Likert value rating.
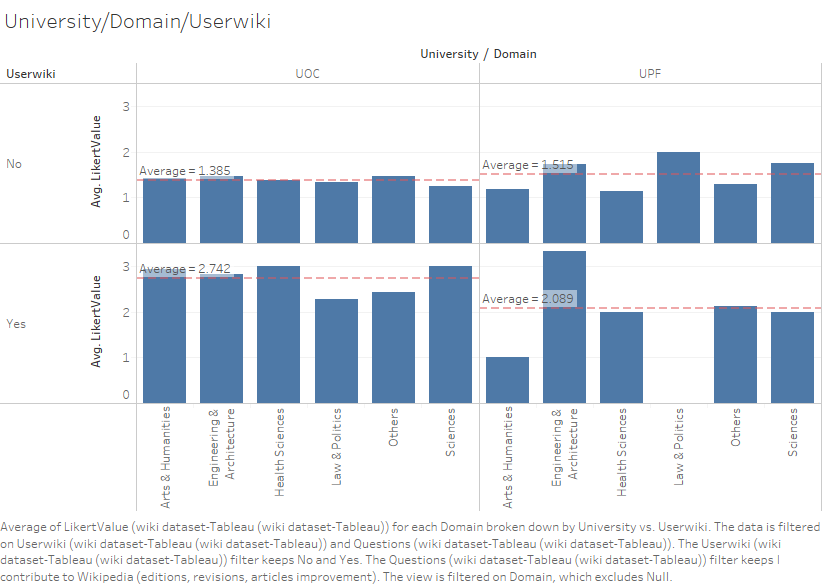
From the trellis chart above, it can be seen that there is a distinct difference in Likert Value rating between Wiki user and Non-wiki user. Wiki users tends to rate higher (average Likert value >2) than non-Wiki users rate (average Likert value <=1.5).This is probably because Wiki users are more used to using it and therefore understand the advantage of Wikipedia better which leads to higher rating on the survey. Another interesting thing can be observed from this graph is that respondents from UOC are on both extremes (highest and lowest) in terms of average likert value.
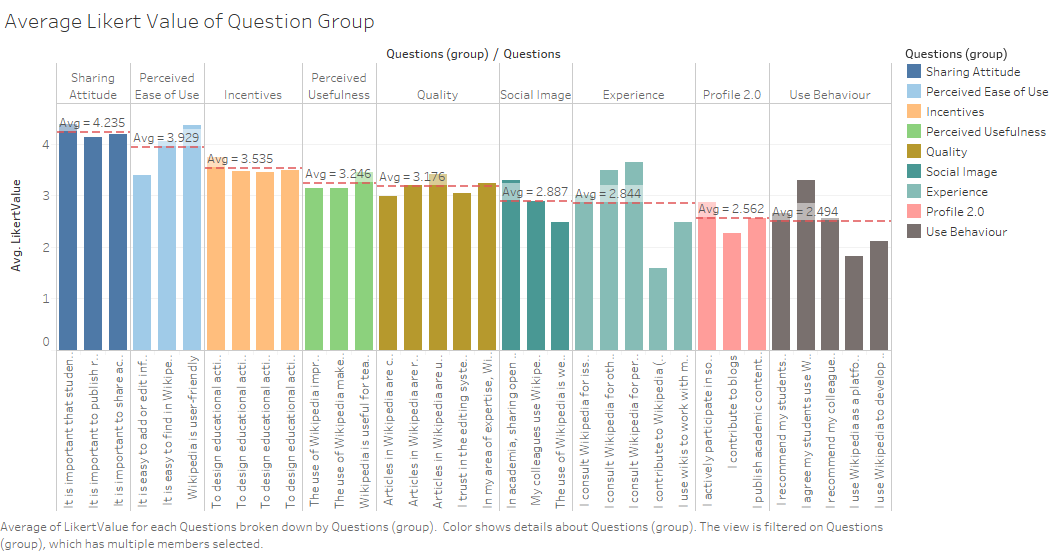
From this chart, it can be seen that most of the respondents rated high (average Likert value = 4.235) for "Sharing Attitude" questions while they rated relatively lower (average Likert value <= 2.5) for "Profile" and "Use Behavior" questions. This indicates that most of the respondents realized that it is important for them to share and publish academic content and research results in online platform such as Wikipedia but they are unlikely to participate actively or recommend their students and colleagues to use Wikipedia.
Interactive Visualization
These are the links to the Tableau Public :
Dashboard 1 [1]
Dashboard 2[2]
Tools Utilized
The tools used for this analysis are Tableau 10.0, JMP Pro12, and Microsoft Excel, Tableau Public.
- Tableau 10.0 is used to visualize the data.
- JMP Pro12 is used to clean and prepare the data before it can be used for further analysis.
- Microsoft Excel is used to clean and reshape the data so that it will be easier to visualize.
- Tableau Public is used to enable interactive visualization of the charts.
Charts used: Bar Chart, Stacked bar Chart, Treemap, Trellis Chart
References
Below are some of the references that are used as a guide:
http://www.datarevelations.com/using-tableau-to-visualize-survey-data-part-1.html
http://www.datarevelations.com/using-tableau-to-visualize-survey-data-part-2.html
