Difference between revisions of "ISSS608 2016-17 T1 Assign2 WEI Jingxian"
| Line 122: | Line 122: | ||
=== Format Conversion === | === Format Conversion === | ||
Since we would like to discover both category level and question level, and it is inefficient if we mass up two level, we imported the modified dataset twice and used them for different conversion. | Since we would like to discover both category level and question level, and it is inefficient if we mass up two level, we imported the modified dataset twice and used them for different conversion. | ||
| + | There is a Pivot function in Tableau can help us to convert the dataset. In the he original dataset, one column represent one catogory or one question. After conversion, there would be only two columns showing the survey result. One is catogory / question and another is response. | ||
* Conversion for category level | * Conversion for category level | ||
| + | [[File:Pivot1.jpeg|400px|frameless|center]] | ||
* Conversion for question level | * Conversion for question level | ||
| + | [[File:Pivot2.jpeg|400px|frameless|center]] | ||
== Exploration == | == Exploration == | ||
Revision as of 15:37, 26 September 2016
Contents
Motivation and Problems
Wikipedia is commonly used in our study and research, but there must be something disappointed users. From Wikipedia aspect, it is essential to know about the attitudes of users, especially university faculty. Because most of university faculty use Wikipedia as an academic reference or a teaching resource and they have more knowledge on their domain, they would be a valuable source of feedback about how well Wikipedia done and what need to be improved in academic area.Based on the survey, Wikipedia can know the attitudes of faculty and improve its performance.
Basically, we would like to know what are the best items and what are the worst items. In addition, we want to explore different preference of faculty in different domain or positions.
- ??
- 1.
- 2.
- 3.
- 4.
Data Information
There is a survey on university faculty perceptions and practices of using Wikipedia as a teaching resource. There are totally 43 questions from 13 categories covered in the survey, and the response ranges from 1, which means strongly disagree to 5, which means strongly agree. The dataset can be download from following link. Wiki4HE Data Set
The following table shows the categories and corresponding questions of the survey
| No. | Survey Categories | Corresponding Survey Questions |
|---|---|---|
| 1 | Perceived usefulness |
PU1: The use of Wikipedia makes it easier for students to develop new skills |
| 2 | Perceived ease of use |
PEU1: Wikipedia is user-friendly |
| 3 | Perceived enjoyment |
ENJ1: The use of Wikipedia stimulates curiosity |
| 4 | Quality |
QU1: Articles in Wikipedia are reliable |
| 5 | Visibility |
VIS1: Wikipedia improves visibility of students' work |
| 6 | Social image |
IM1: The use of Wikipedia is well considered among colleagues |
| 7 | Sharing attitude |
SA1: It is important to share academic content in open platforms |
| 8 | Use behavior |
USE1: I use Wikipedia to develop my teaching materials |
| 9 | Profile 2.0 |
PF1: I contribute to blogs |
| 10 | Job relevance |
JR1: My university promotes the use of open collaborative environments in the Internet |
| 11 | Behavioral intention |
BI1: In the future I will recommend the use of Wikipedia to my colleagues and students |
| 12 | Incentives |
INC1: To design educational activities using Wikipedia, it would be helpful: a best practices guide |
| 13 | Experience |
EXP1: I consult Wikipedia for issues related to my field of expertise |
Data Preparation
Replacement
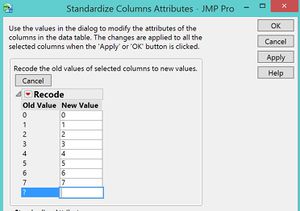
First of all, it is necessary to check the missing data before we start analysing. There are many '?' excited in several columns, and JMP would treat these columns as character, which is inappropriate data type for answers. Thus, we need to replace all the '?' with null value and change the type of answers into numeric.
Calculation in JMP
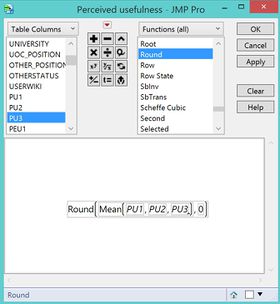
In order to check the overall performance of each category, we calculate the averages of questions under each category, and use them to represent the responses of categories. The sample formula is shown in the screenshot below.
Calculation in Tableau
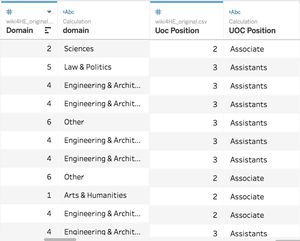
In the dataset, variables related to faculty profile are measured by number, so they cannot be checked directly. Therefore, for these variables, including domain, Uoc position and gender, we create new variables with actual meanings to replace the original variables.
Also, we create groups for age and years of university teaching experience (yearexp), so that we can present them clearer and more easily.
| Groups | Criterion | Groups | Criterion |
|---|---|---|---|
| Age Groups |
20+ |
Yearexp Groups |
<10 |
Format Conversion
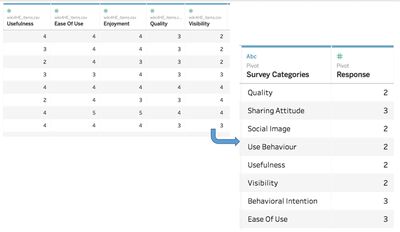
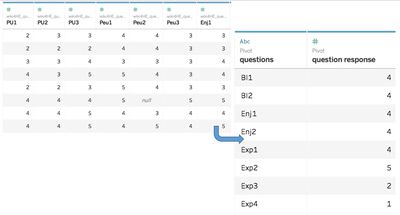
Since we would like to discover both category level and question level, and it is inefficient if we mass up two level, we imported the modified dataset twice and used them for different conversion. There is a Pivot function in Tableau can help us to convert the dataset. In the he original dataset, one column represent one catogory or one question. After conversion, there would be only two columns showing the survey result. One is catogory / question and another is response.
- Conversion for category level
- Conversion for question level
