Difference between revisions of "ISSS608 2016-17 T1 Assign2 YANG Yuwei"
(11) |
(13) |
||
| Line 13: | Line 13: | ||
== Dataset == | == Dataset == | ||
=== Data description === | === Data description === | ||
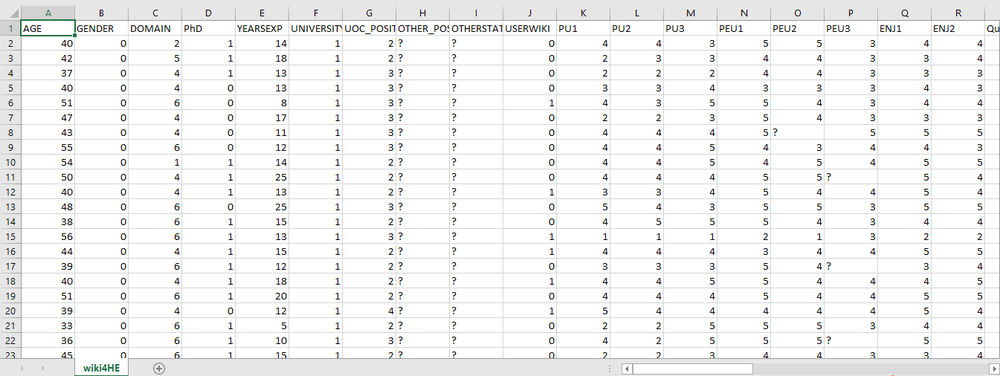
| − | The dataset I used is from UCI, named [https://archive.ics.uci.edu/ml/datasets/wiki4HE wiki4HE] which is a research on university faculty perceptions and practices of using Wikipedia as a teaching resource. It contains 913 instances and 53 attributes, which includes the information of the interviewee (demographic questions) and the perception about Wikipedia of interviewee (Likert scale questions). | + | The dataset I used is from UCI, named [https://archive.ics.uci.edu/ml/datasets/wiki4HE wiki4HE] which is a research on university faculty perceptions and practices of using Wikipedia as a teaching resource. It contains 913 instances and 53 attributes, which includes the information of the interviewee (demographic questions) and the perception about Wikipedia of interviewee (Likert scale questions). The raw data showed as below. |
| + | [[File:Before.png|1000px|thumbnail|center]] | ||
=== Data preparation === | === Data preparation === | ||
| − | + | First, I define new columns of Gender, PhD or Not, University and Domain by using IF function in JMP. I convert the original numerical data to text(character type). | |
| + | Then, In order to get easier to explore the data and build visualizations, I want to reshape the data. | ||
| + | * Give each interviewee a n unique ID. | ||
| + | * Then, using Excel and the Tableau reshaping add-in to create two new columns, one is Likert Question, the other is Likert Response. | ||
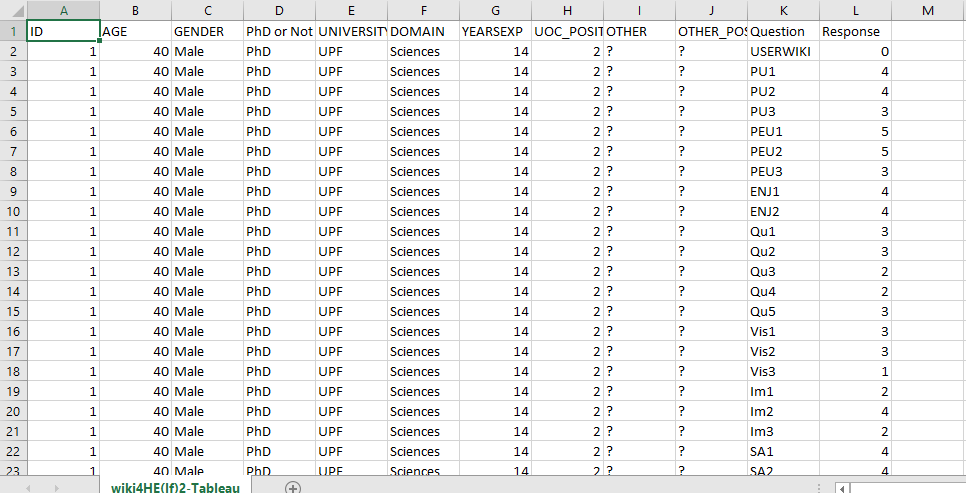
| + | Excel workbook that contains reshaped data that looks like this: | ||
| + | [[File:Reshaped.png|1000px|thumbnail|center]] | ||
Notice that there is a separate row for each question in the survey and that the ID, Age, Gender, PhD or Not, University and Domain data is repeated for each survey interviewee. This is what is called “normalized” data. | Notice that there is a separate row for each question in the survey and that the ID, Age, Gender, PhD or Not, University and Domain data is repeated for each survey interviewee. This is what is called “normalized” data. | ||
== Approaches == | == Approaches == | ||
| + | === Overview of people who use Wikipedia. === | ||
| + | [[File:USERWIKI Barchart.png|500px|thumbnail|center]] | ||
| + | [[File:Mosaic DOMAIN PhD or Not.png|500px|thumbnail|left]][[File:Mosaic GENDER UNIVERSITY.png|500px|thumbnail|right]] | ||
| + | |||
| + | |||
| + | From | ||
| + | [[File:Distribution of Yearexp which use Wiki.jpg|500px|thumbnail|center]] | ||
| + | |||
| + | === Overview of Likert Question score. === | ||
| + | [[File:Overview of Likert Question Score.png|500px|thumbnail|center]] | ||
| + | === Will people who use Wiki recommend Wiki in the future? === | ||
| + | [[File:Will people who use Wiki recommend Wiki in the future.png|1000px|thumbnail|center]] | ||
| + | === Will people be influenced by people around? === | ||
| + | [[File:Parallel Sets.png|1000px|thumbnail|center]] | ||
| + | === Why people do not use Wiki? === | ||
| + | [[File:Why people do not use Wiki.png|1000px|thumbnail|center]] | ||
== Tool Utilized == | == Tool Utilized == | ||
| + | * Microsoft Excel: Reshape Data | ||
| + | * JMP: Trellis Chart | ||
| + | * Tableau: Bar Chart, Divergent bar chart | ||
| + | * Mondrian: Mosaic plot | ||
| + | * Parallel Sets: Parallel Sets | ||
== Conclusion == | == Conclusion == | ||
Revision as of 01:22, 26 September 2016
Abstract
Using Wikipedia as a teaching tool is an activity that goes beyond a simple addition to the teaching repertoire, and allows contributing to our society through service learning and participation in an online community of practice. Contributing to Wikipedia benefits students, instructors and the wider community. In this project, I’d like to construct visualization to make our readers easily understand the situation of using Wikipedia. Reference:http://firstmonday.org/article/view/3583/3313
Theme and Problems
In this project, I will focus on the situation of using Wikipedia. Based on the theme, I will discuss some question as follow:
- What kind of people use Wikipedia?
- What kind of people use Wikipedia?
- What kind of issue is people regards as important in Wikipedia?
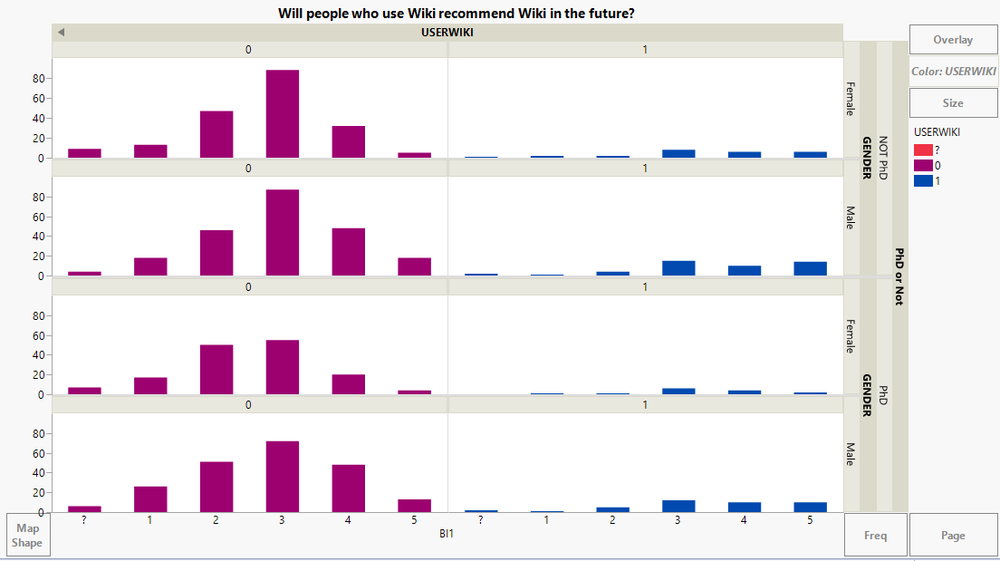
- Will people who used Wiki recommend other people to use Wiki in the future?
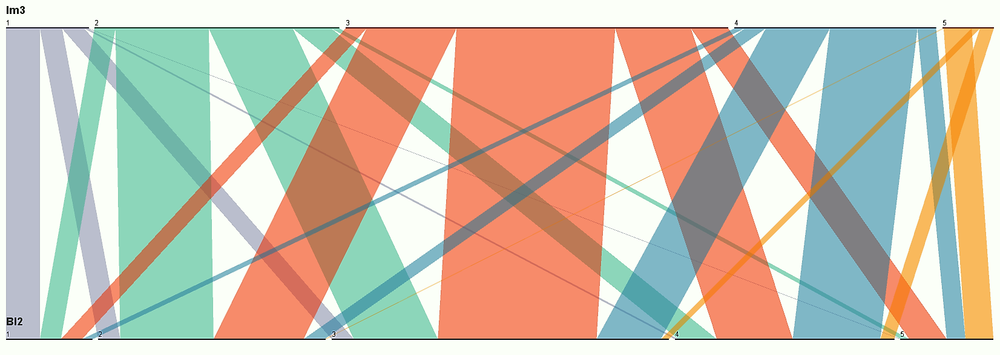
- Will people be influenced by people around?
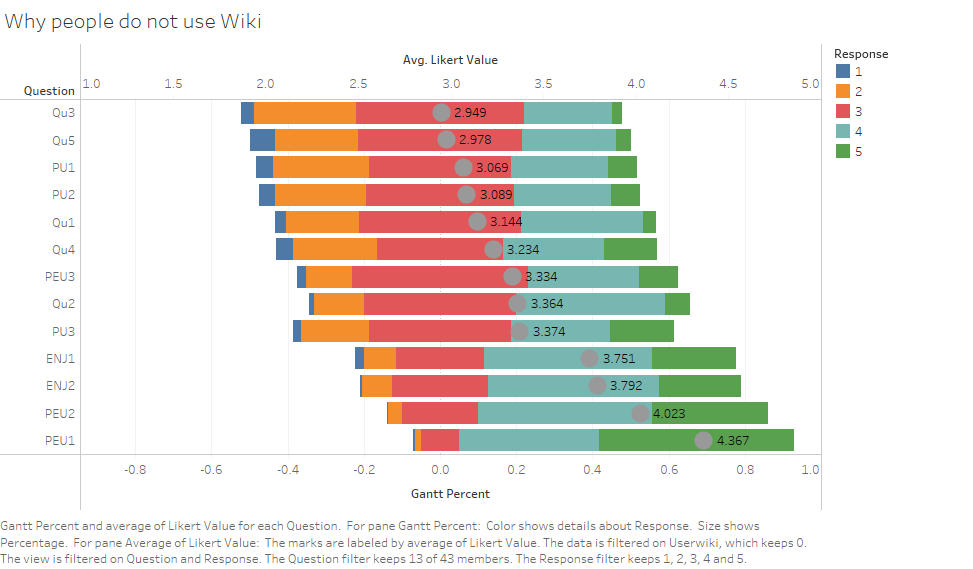
- Why people do not use Wiki?
Dataset
Data description
The dataset I used is from UCI, named wiki4HE which is a research on university faculty perceptions and practices of using Wikipedia as a teaching resource. It contains 913 instances and 53 attributes, which includes the information of the interviewee (demographic questions) and the perception about Wikipedia of interviewee (Likert scale questions). The raw data showed as below.
Data preparation
First, I define new columns of Gender, PhD or Not, University and Domain by using IF function in JMP. I convert the original numerical data to text(character type).
Then, In order to get easier to explore the data and build visualizations, I want to reshape the data.
- Give each interviewee a n unique ID.
- Then, using Excel and the Tableau reshaping add-in to create two new columns, one is Likert Question, the other is Likert Response.
Excel workbook that contains reshaped data that looks like this:
Notice that there is a separate row for each question in the survey and that the ID, Age, Gender, PhD or Not, University and Domain data is repeated for each survey interviewee. This is what is called “normalized” data.
Approaches
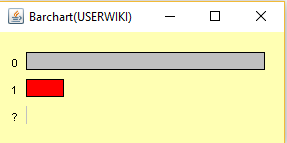
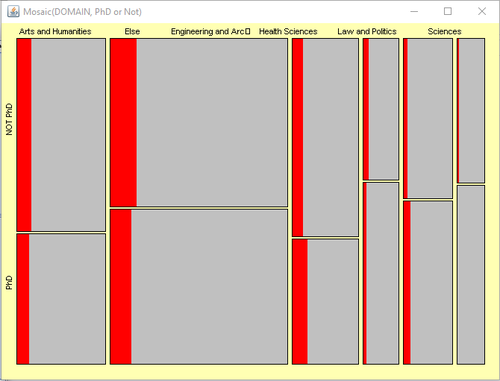
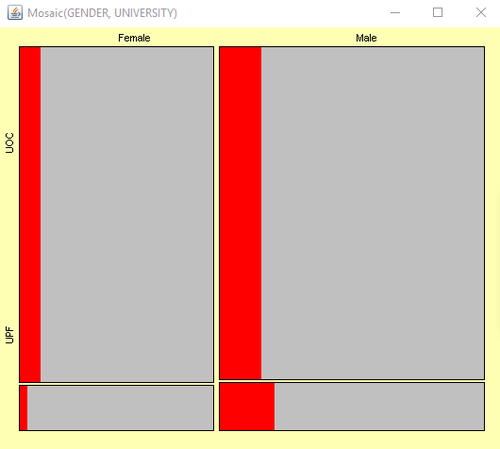
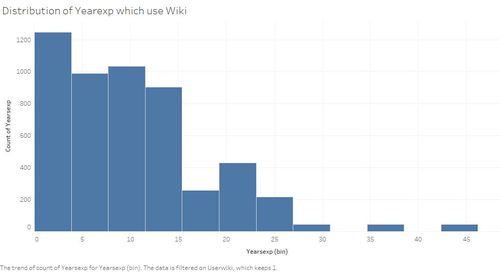
Overview of people who use Wikipedia.
From
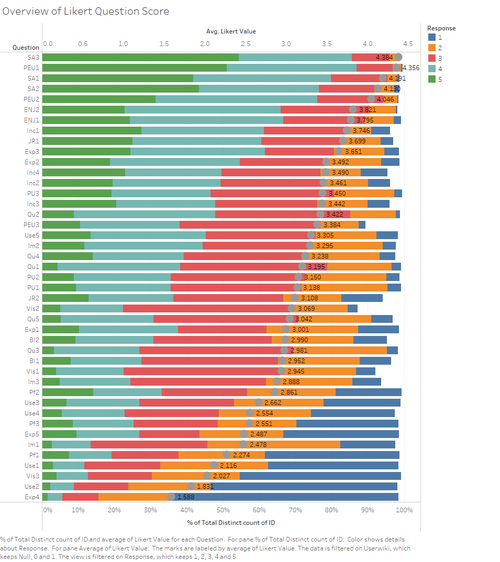
Overview of Likert Question score.
Will people who use Wiki recommend Wiki in the future?
Will people be influenced by people around?
Why people do not use Wiki?
Tool Utilized
- Microsoft Excel: Reshape Data
- JMP: Trellis Chart
- Tableau: Bar Chart, Divergent bar chart
- Mondrian: Mosaic plot
- Parallel Sets: Parallel Sets
