File list
Jump to navigation
Jump to search
This special page shows all uploaded files.
| Date | Name | Thumbnail | Size | Description | Versions |
|---|---|---|---|---|---|
| 12:43, 29 August 2016 | Singapore Map.jpg (file) |  |
120 KB | Map obtained from http://launches.com.sg/#pmap | 1 |
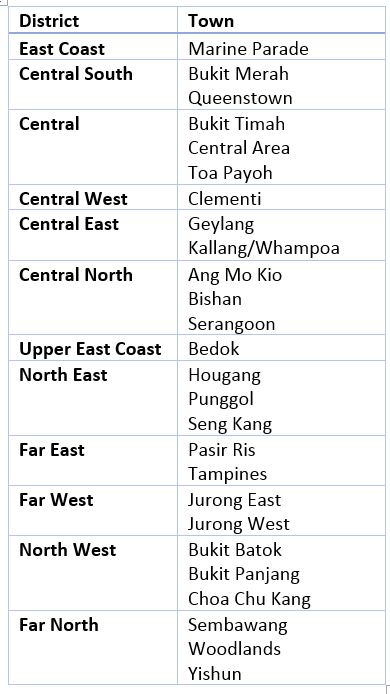
| 13:09, 29 August 2016 | Regions Mapping.JPG (file) |  |
60 KB | Mapping of Town to Regions | 1 |
| 13:28, 29 August 2016 | Resale Share by Flat Type - Year 2015.jpg (file) |  |
95 KB | 1 | |
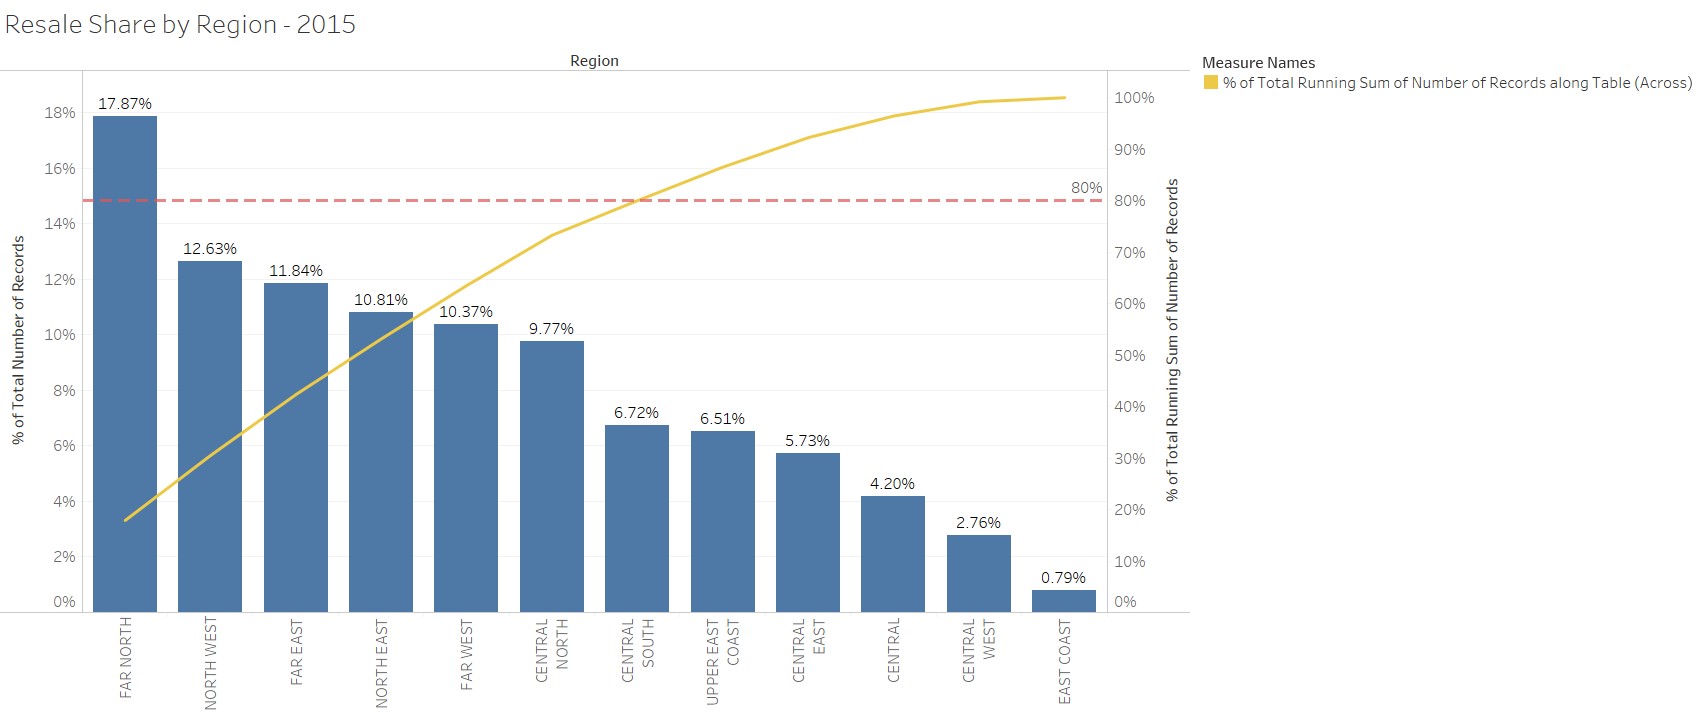
| 13:30, 29 August 2016 | Resale Share by Regions - Year 2015.jpg (file) |  |
111 KB | 1 | |
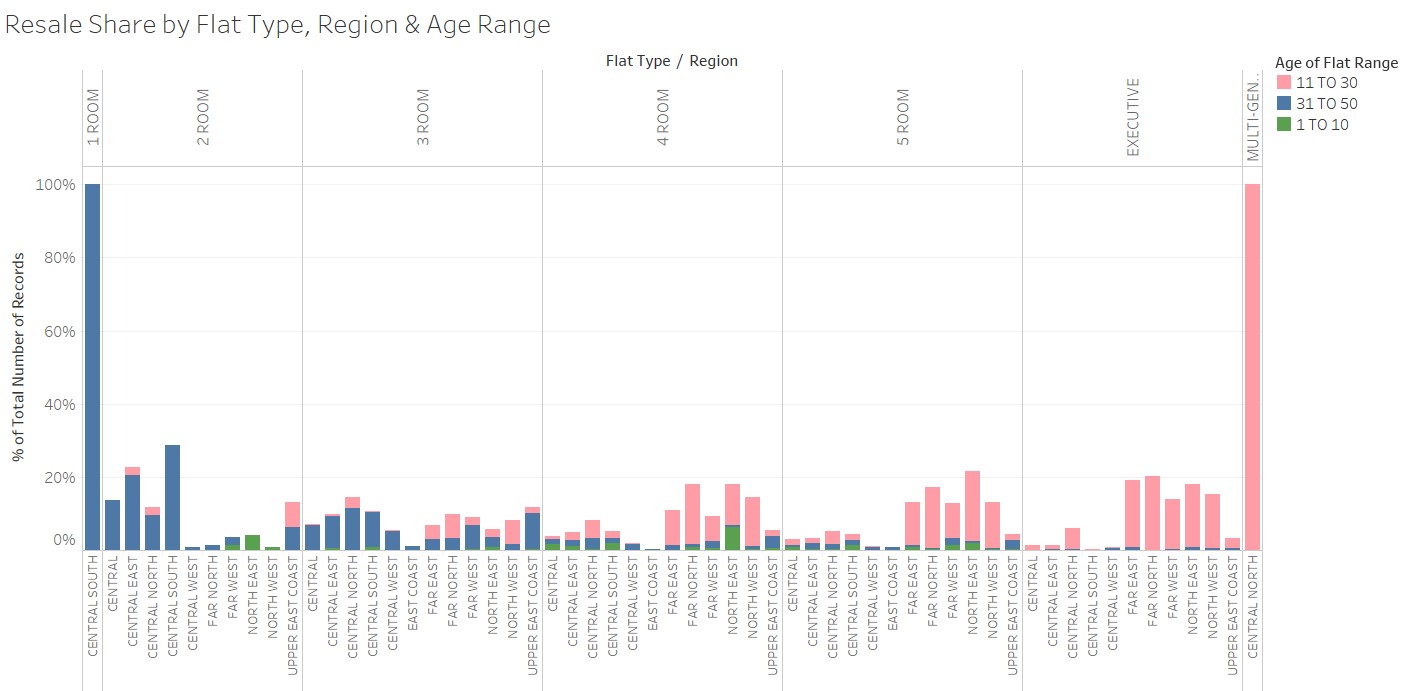
| 13:51, 29 August 2016 | Resale Share by Flat Type, Region & Age Range - Year 2015.jpg (file) |  |
121 KB | 1 | |
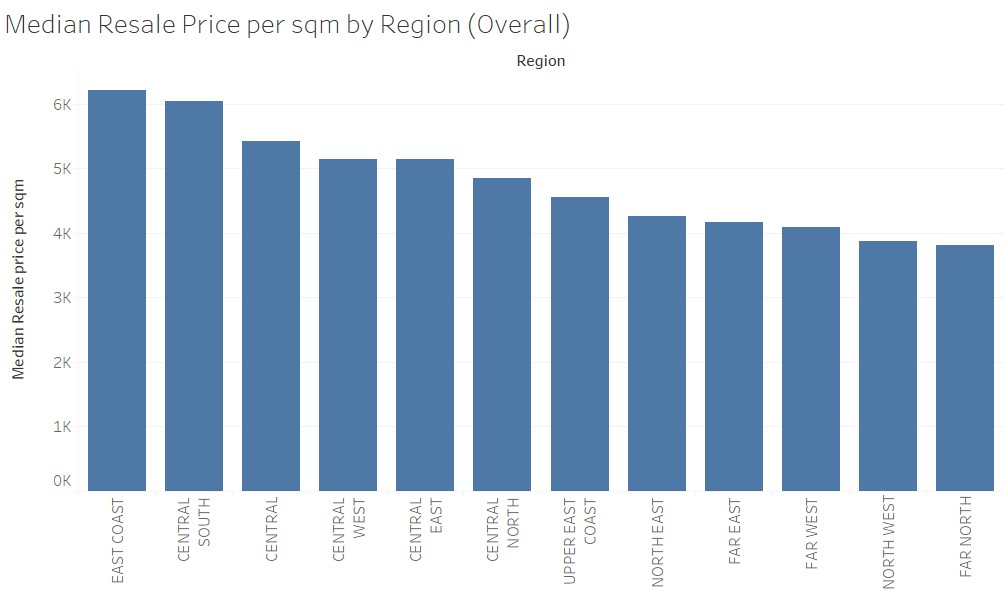
| 14:19, 29 August 2016 | Median Resale Price per sqm by Region - Year 2015.jpg (file) |  |
65 KB | 1 | |
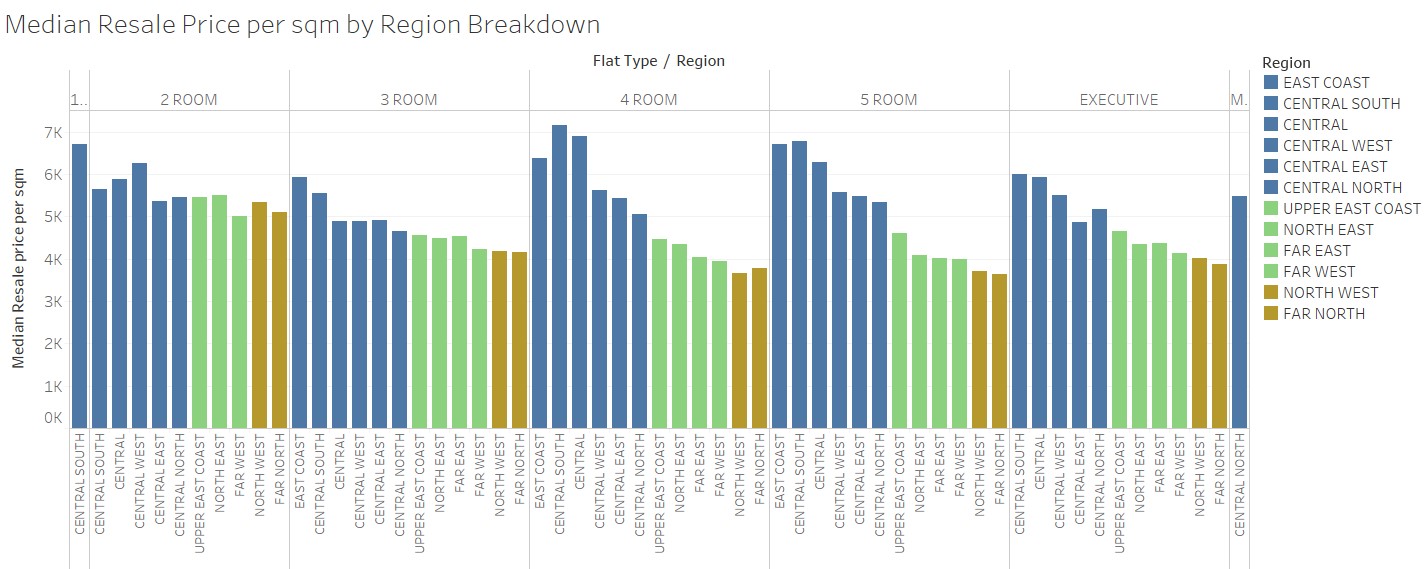
| 14:19, 29 August 2016 | Median Resale Price per sqm by Region & Flat Type - Year 2015.jpg (file) |  |
170 KB | 1 | |
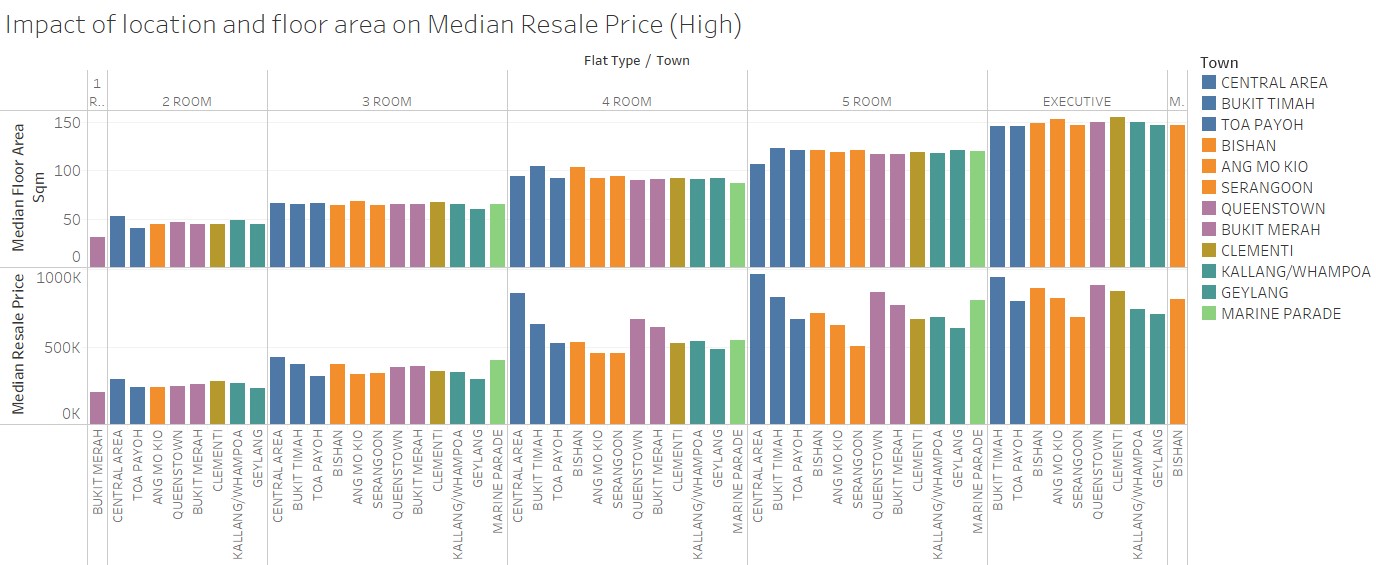
| 14:20, 29 August 2016 | Impact of location and floor area on Median Resale Price (High).jpg (file) | .jpg) |
161 KB | 1 | |
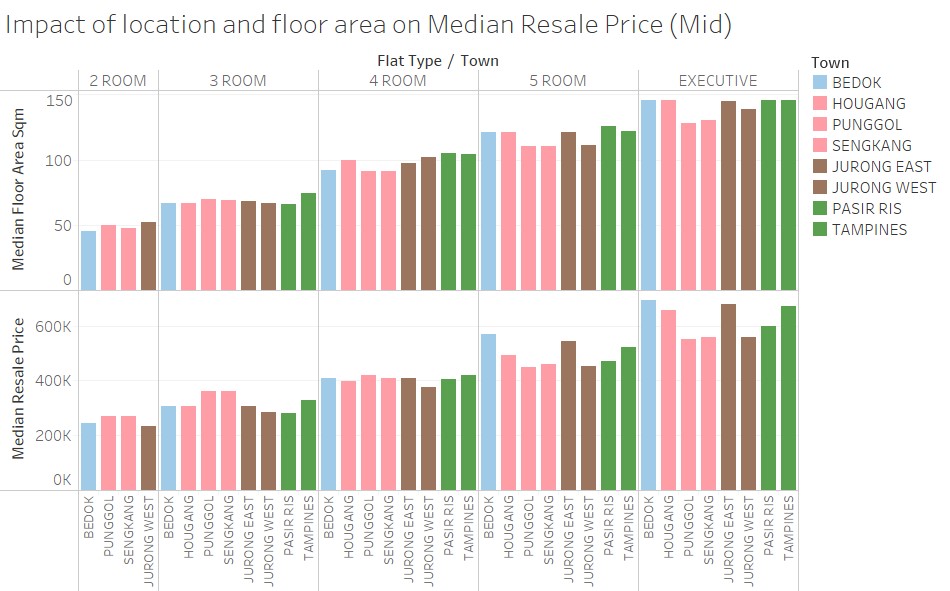
| 14:20, 29 August 2016 | Impact of location and floor area on Median Resale Price (Mid).jpg (file) | .jpg) |
113 KB | 1 | |
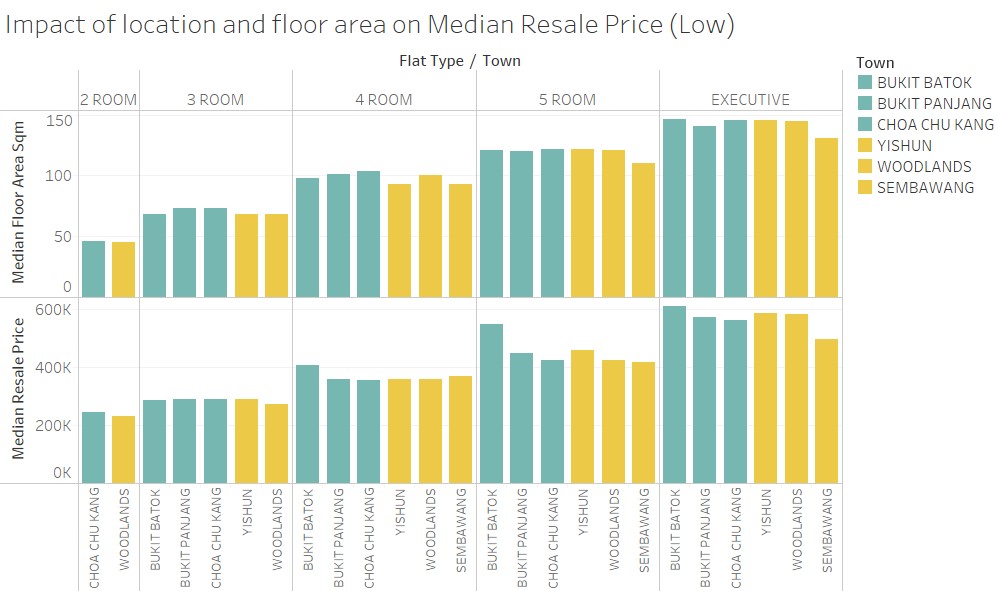
| 14:20, 29 August 2016 | Impact of location and floor area on Median Resale Price (Low).jpg (file) | .jpg) |
107 KB | 1 | |
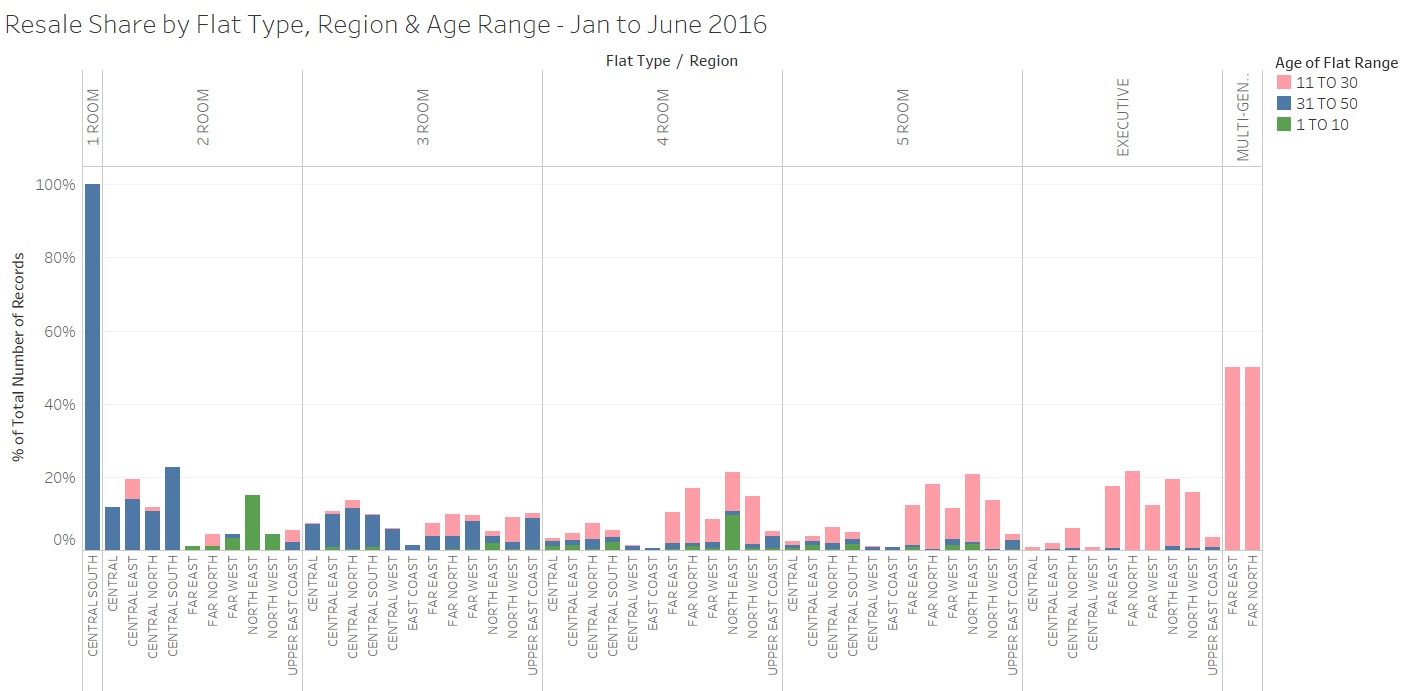
| 14:21, 29 August 2016 | Resale Share by Flat Type, Region & Age Range - Year 2016.jpg (file) |  |
124 KB | 1 | |
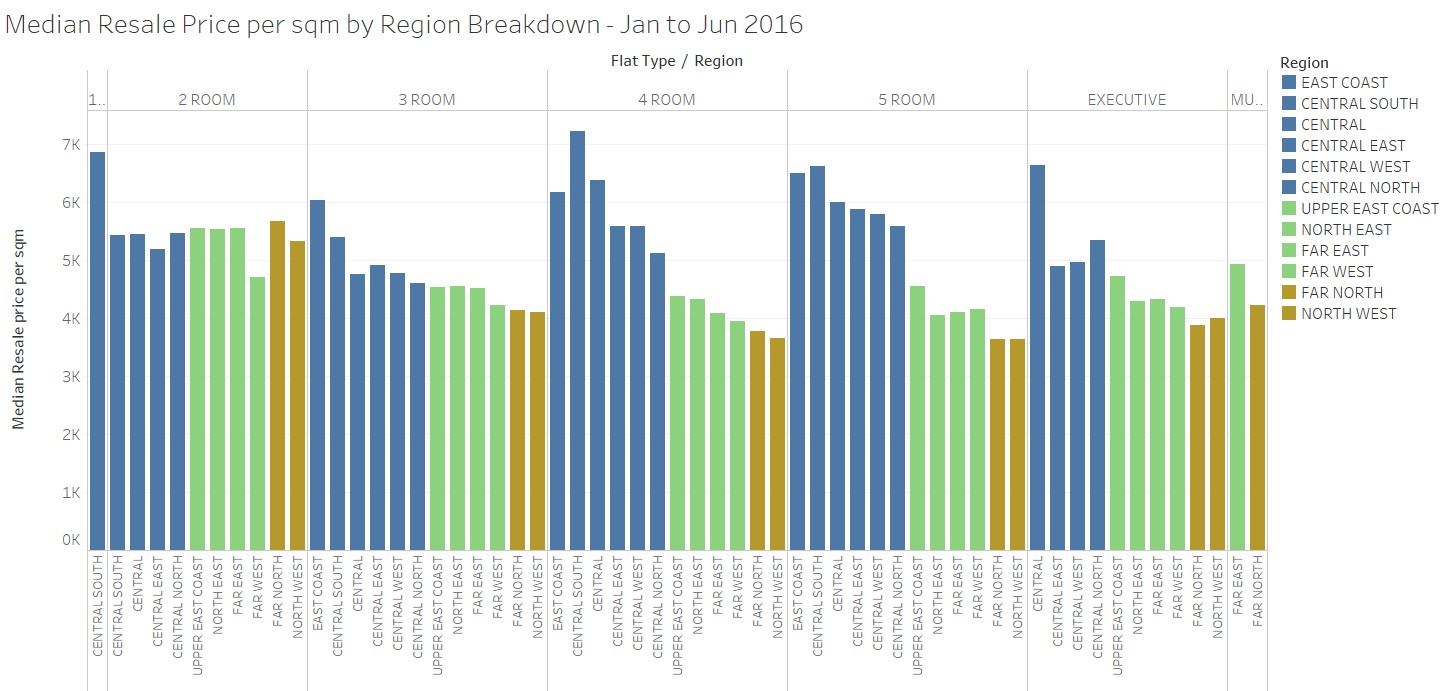
| 14:21, 29 August 2016 | Median Resale Price per sqm by Region & Flat Type - Year 2016.jpg (file) |  |
196 KB | 1 | |
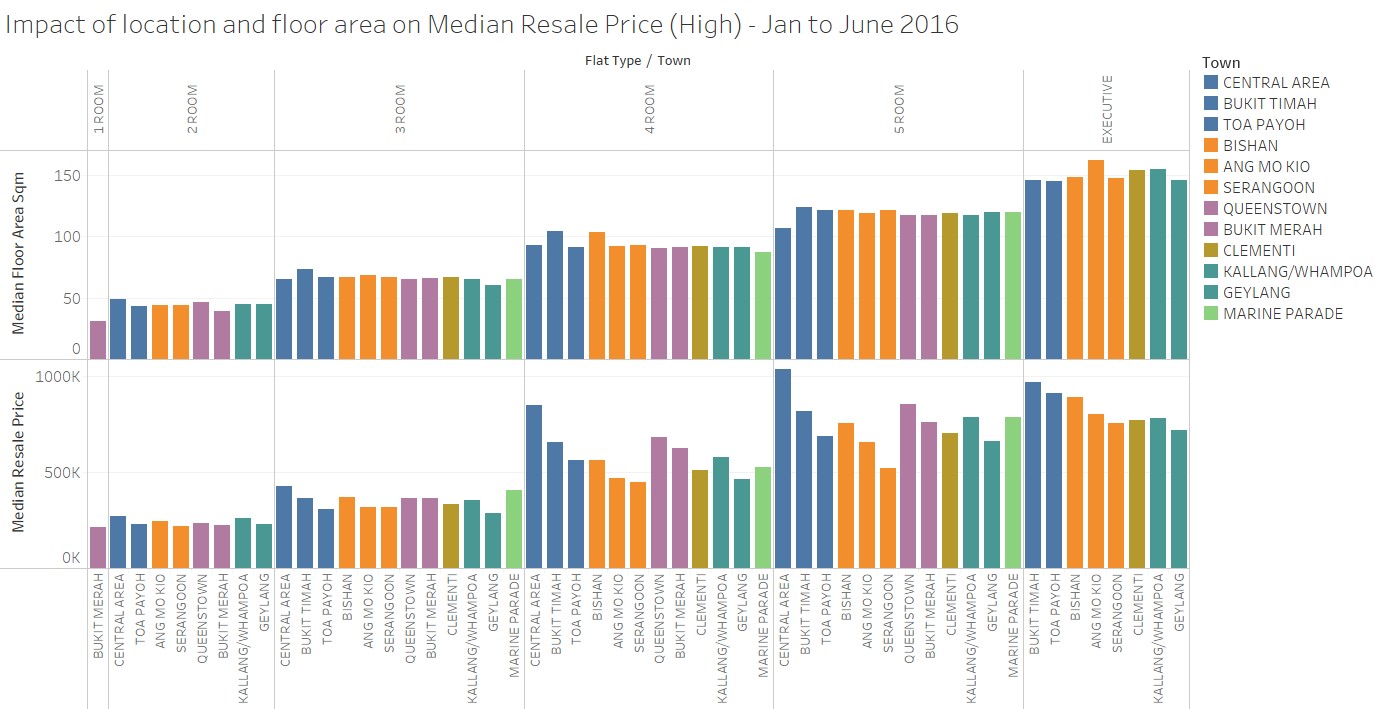
| 14:30, 29 August 2016 | Impact of location and floor area on Median Resale Price (High) - Year 2016.jpg (file) | _-_Year_2016.jpg) |
173 KB | 2 | |
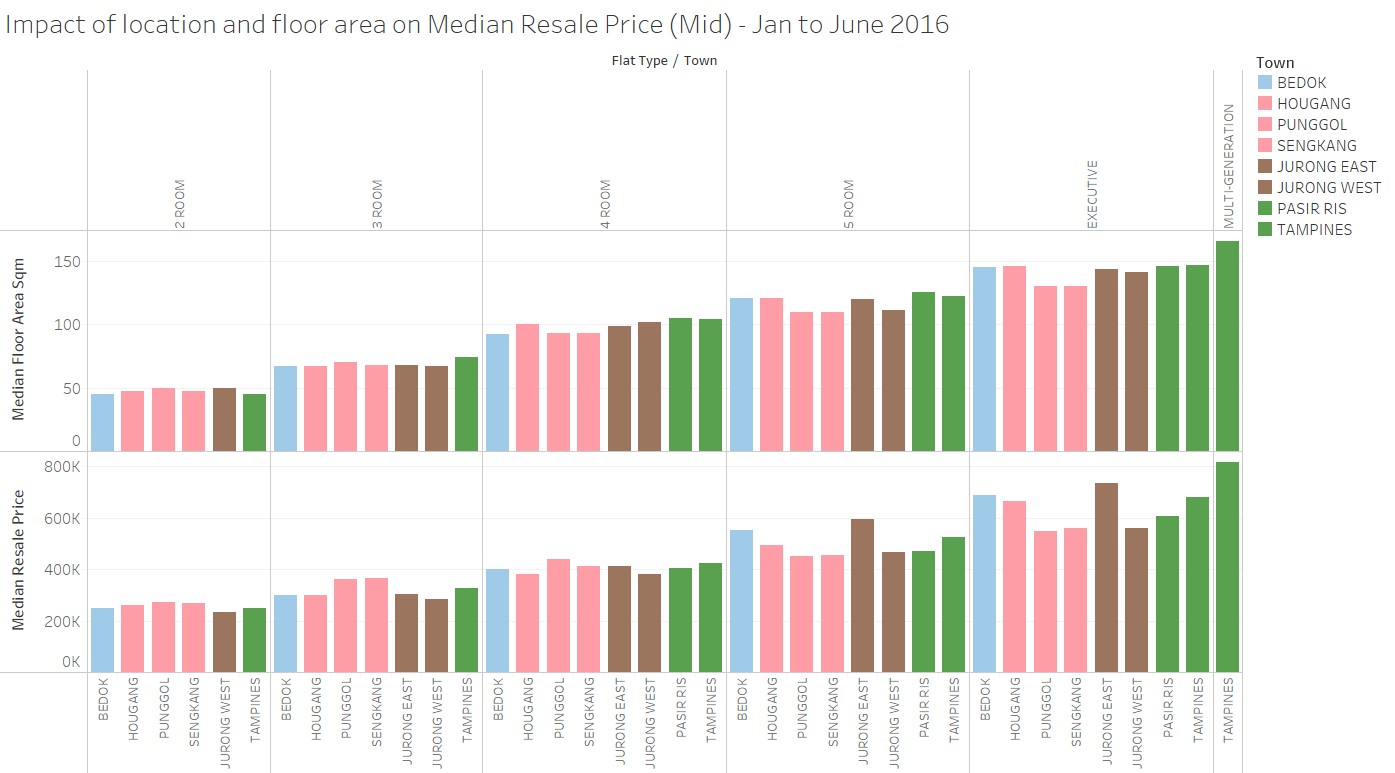
| 14:30, 29 August 2016 | Impact of location and floor area on Median Resale Price (Mid) - Year 2016.jpg (file) | _-_Year_2016.jpg) |
147 KB | 1 | |
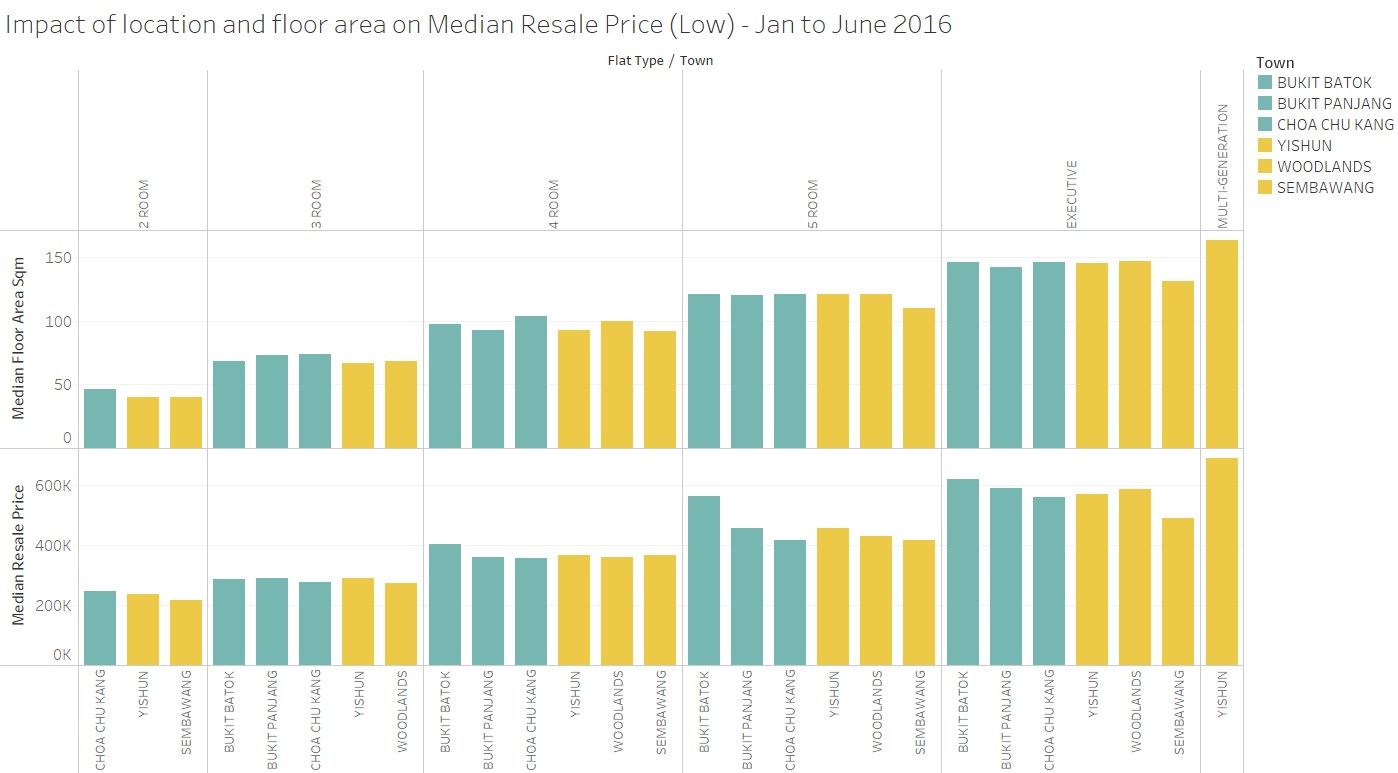
| 14:31, 29 August 2016 | Impact of location and floor area on Median Resale Price (Low) - Year 2016.jpg (file) | _-_Year_2016.jpg) |
132 KB | 1 | |
| 17:33, 25 September 2016 | Profile of Survey Respondents.jpg (file) |  |
227 KB | Treemap: Profile of Survey Respondents (Domain, Teaching Position, Age Range, Years of Experience) developed with TIBCO Spotfire | 1 |
| 18:28, 25 September 2016 | Profile of Survey Respondents (2).JPG (file) | .JPG) |
107 KB | Treemap: Profile of Survey Respondents (Domain, Teaching Position, Age Range, Years of Experience) developed with TIBCO Spotfire | 1 |
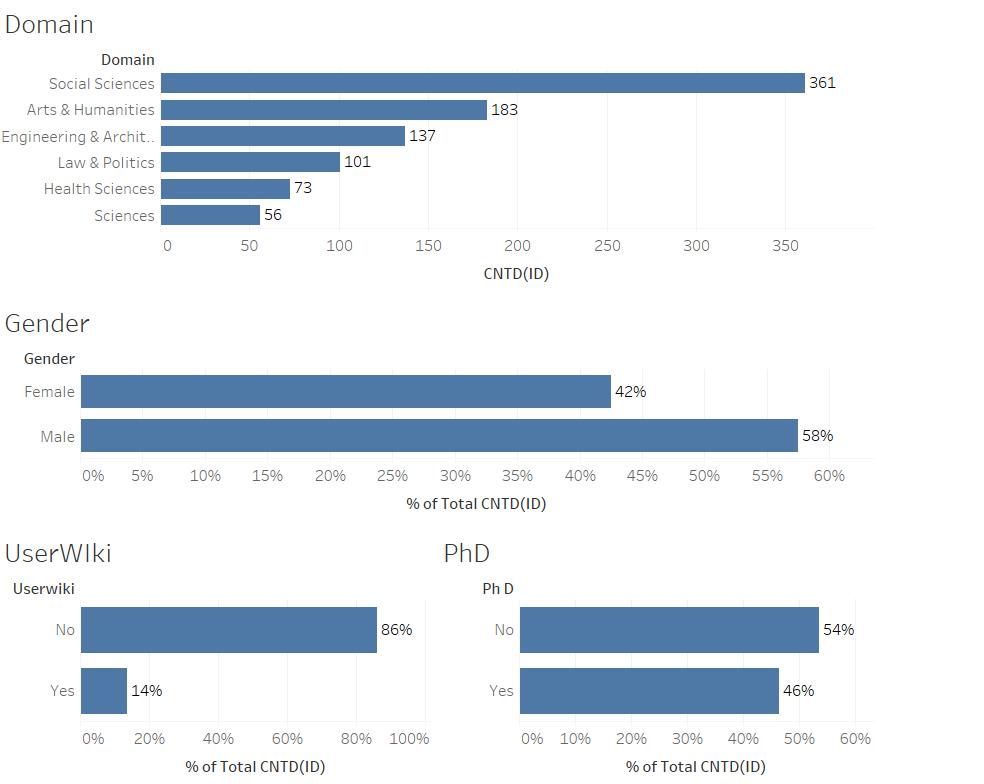
| 19:35, 25 September 2016 | Profile (Domain, Gender, UserWiki, PhD).jpg (file) | .jpg) |
57 KB | 3 | |
| 19:44, 25 September 2016 | Profile (Domain, Gender, UserWiki, PhD) by Domain.JPG (file) | _by_Domain.JPG) |
109 KB | Profile (Domain, Gender, UserWiki, PhD)_by Domain | 1 |
| 22:58, 25 September 2016 | Likert Scale - Divergent Stacked Bar Chart.jpg (file) |  |
108 KB | Example of Interactive Likert Scale Survey Results Dashboard | 1 |
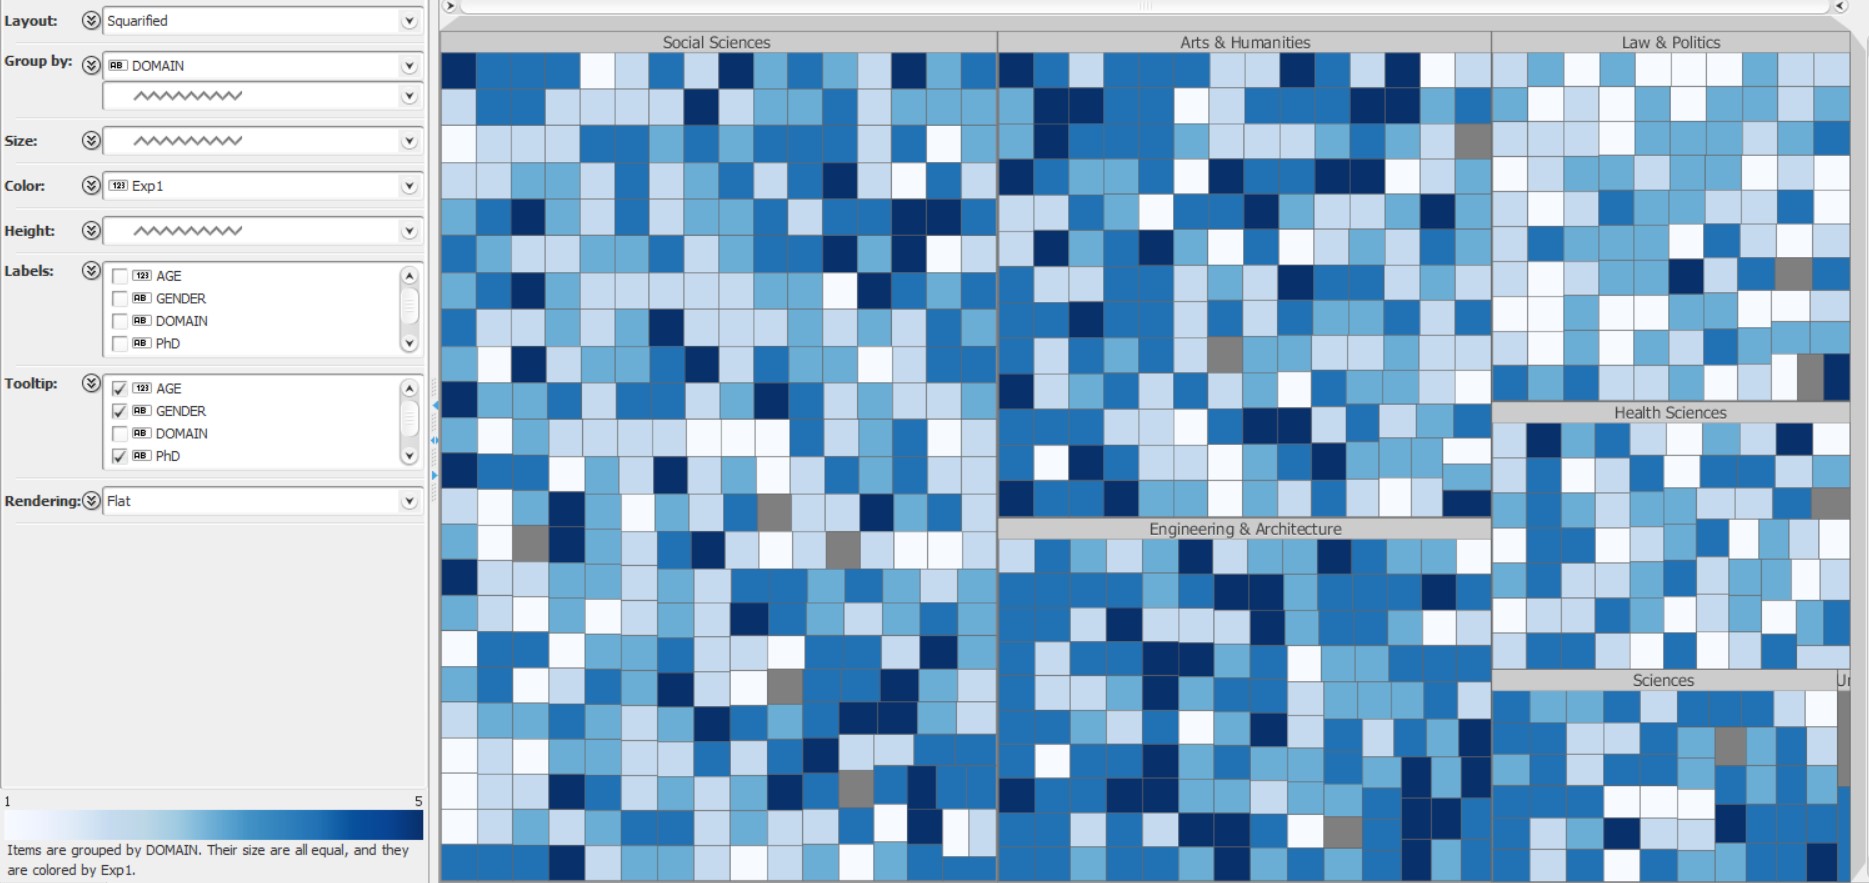
| 01:44, 26 September 2016 | Treemap- EXP1 based on Domain.jpg (file) |  |
250 KB | Treemap: EXP1 - I consult Wikipedia for issues related to my field of expertise | 1 |
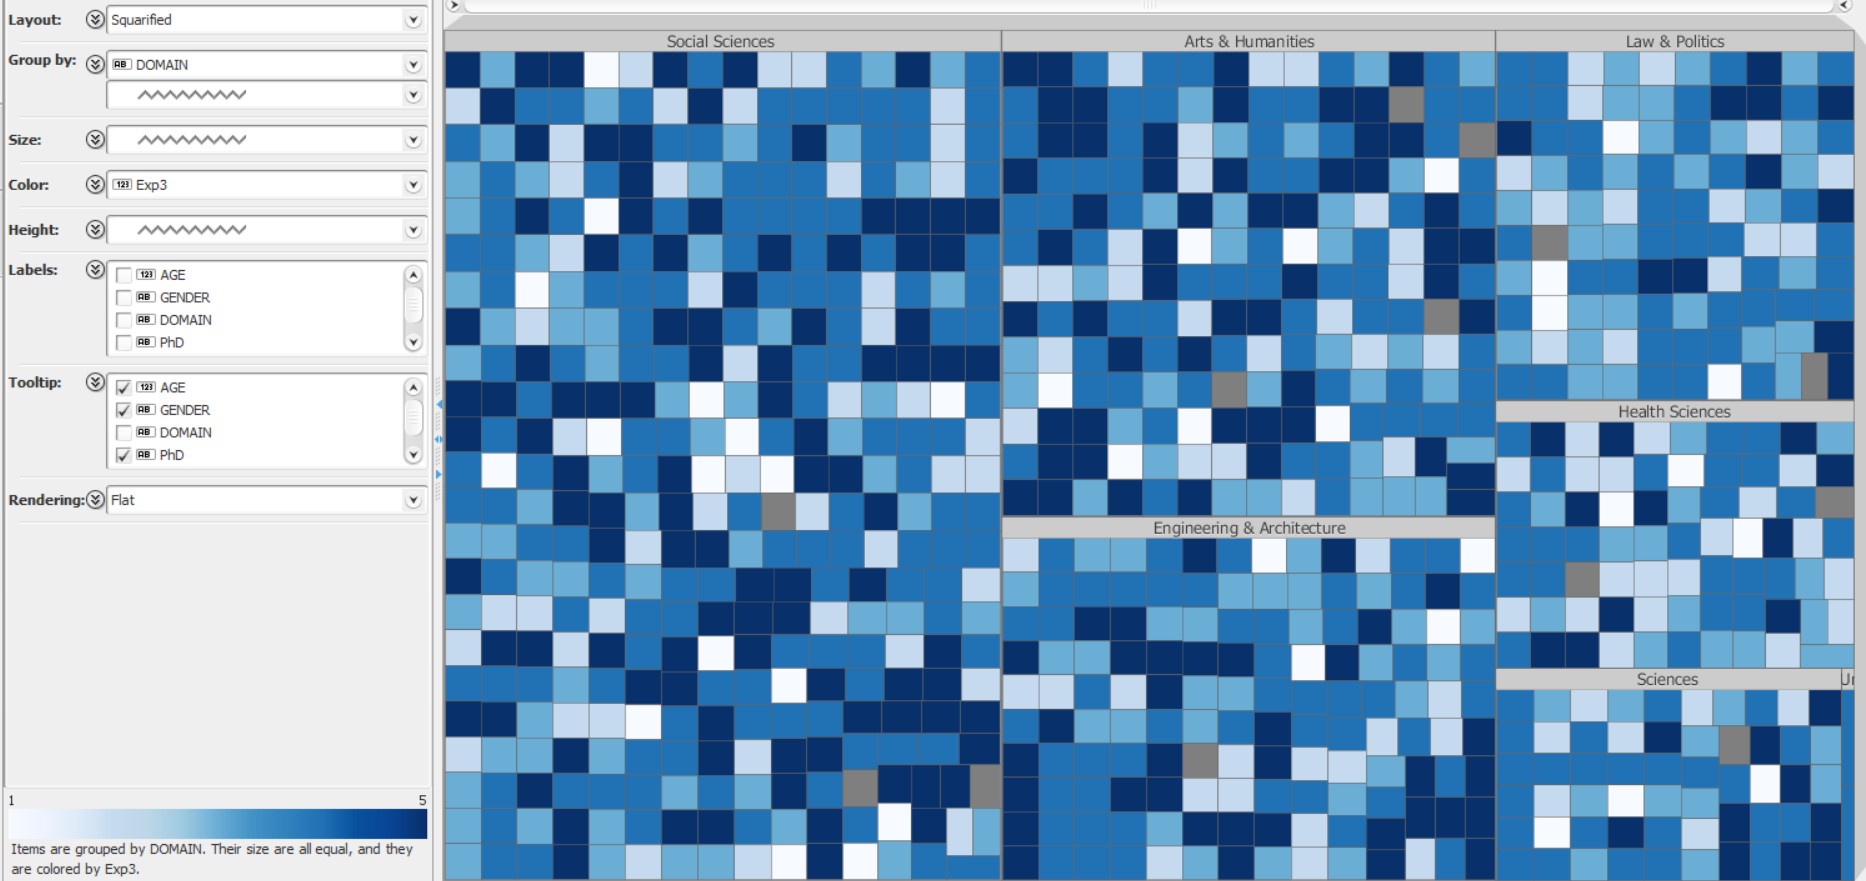
| 01:48, 26 September 2016 | Treemap- EXP3 based on Domain.jpg (file) |  |
241 KB | EXP3 - I consult Wikipedia for personal issues | 1 |
| 01:52, 26 September 2016 | Treemap- USE3 based on Domain.jpg (file) |  |
260 KB | Treemap - USE3: I recommend my students to use Wikipedia | 1 |
| 01:54, 26 September 2016 | Treemap- USE5 based on Domain.jpg (file) |  |
251 KB | Treemap - USE5: I agree my students use Wikipedia in my courses | 1 |
| 02:03, 26 September 2016 | Treemap- Intensity Scale.jpg (file) | 4 KB | Treemap Intensity Scale 1 to 5 | 1 | |
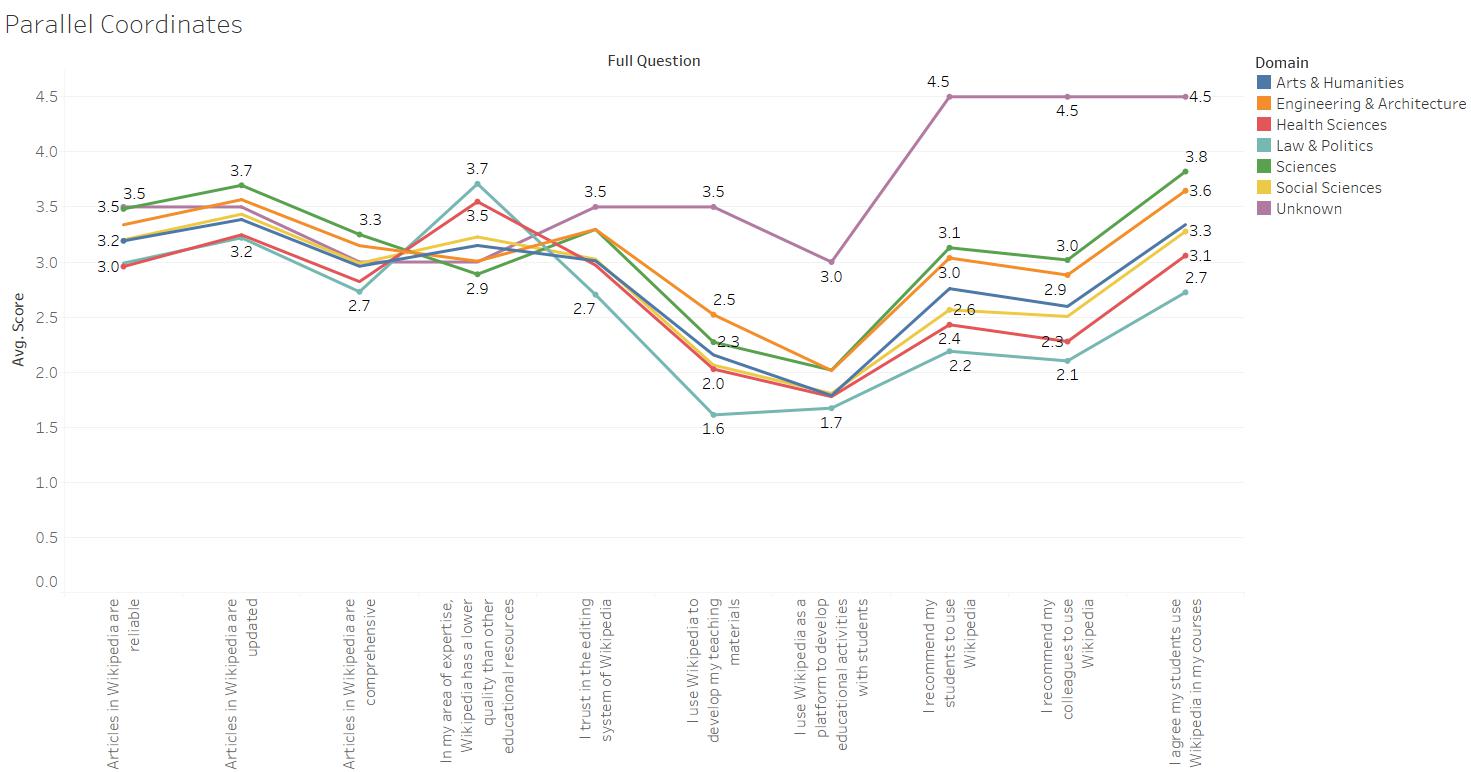
| 11:43, 26 September 2016 | Parallel Coordinates Quality vs Use.jpg (file) |  |
93 KB | 1 | |
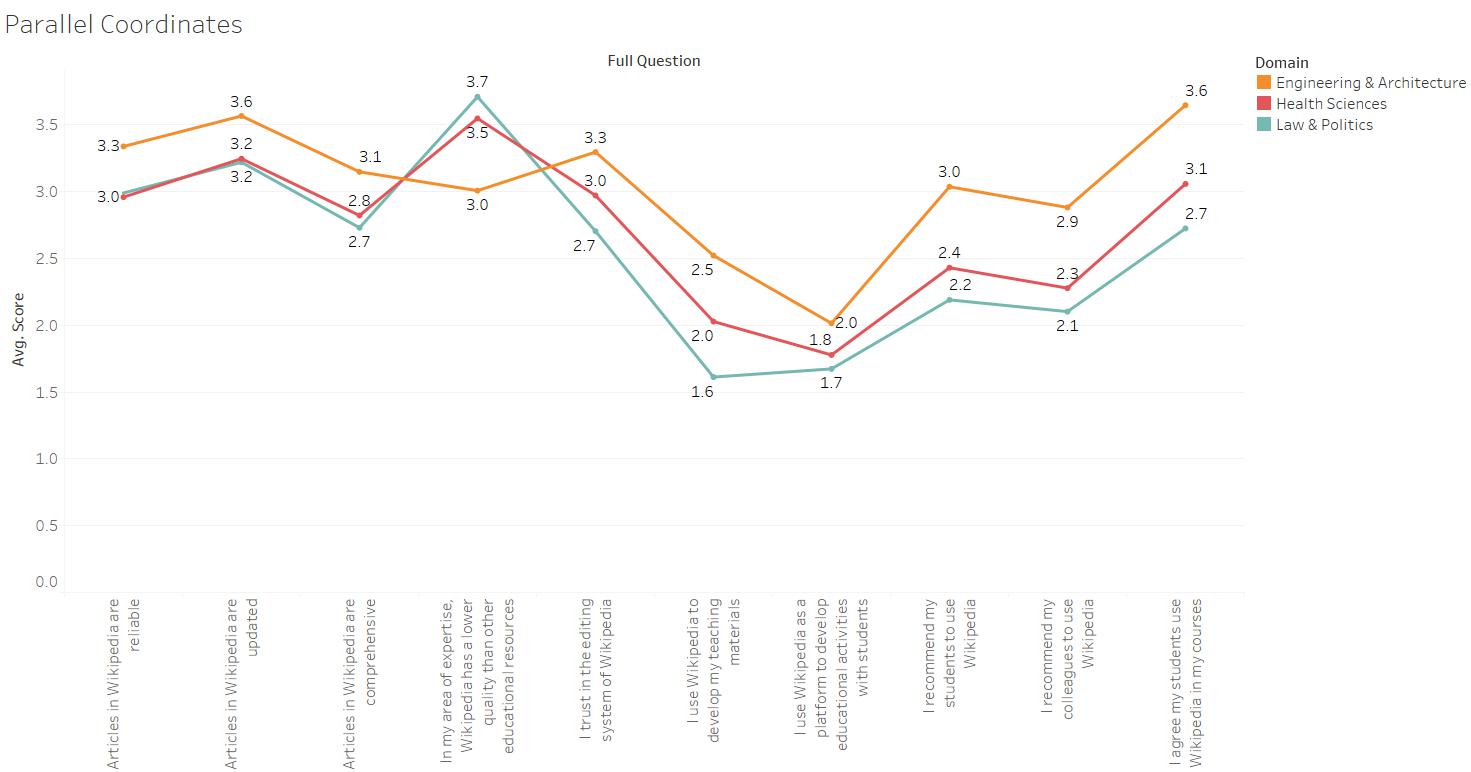
| 11:48, 26 September 2016 | Parallel Coordinates Quality vs Use (Eng,HS & Law).jpg (file) | .jpg) |
75 KB | Average Quality and Use Score (Eng, HS, Law) | 1 |
| 13:41, 26 September 2016 | Divergent Stacked Bar Chart - Social Image and Environment.JPG (file) |  |
142 KB | Faculty members response on Social Image questions and University sentiments towards the use of Wikipedia. | 1 |
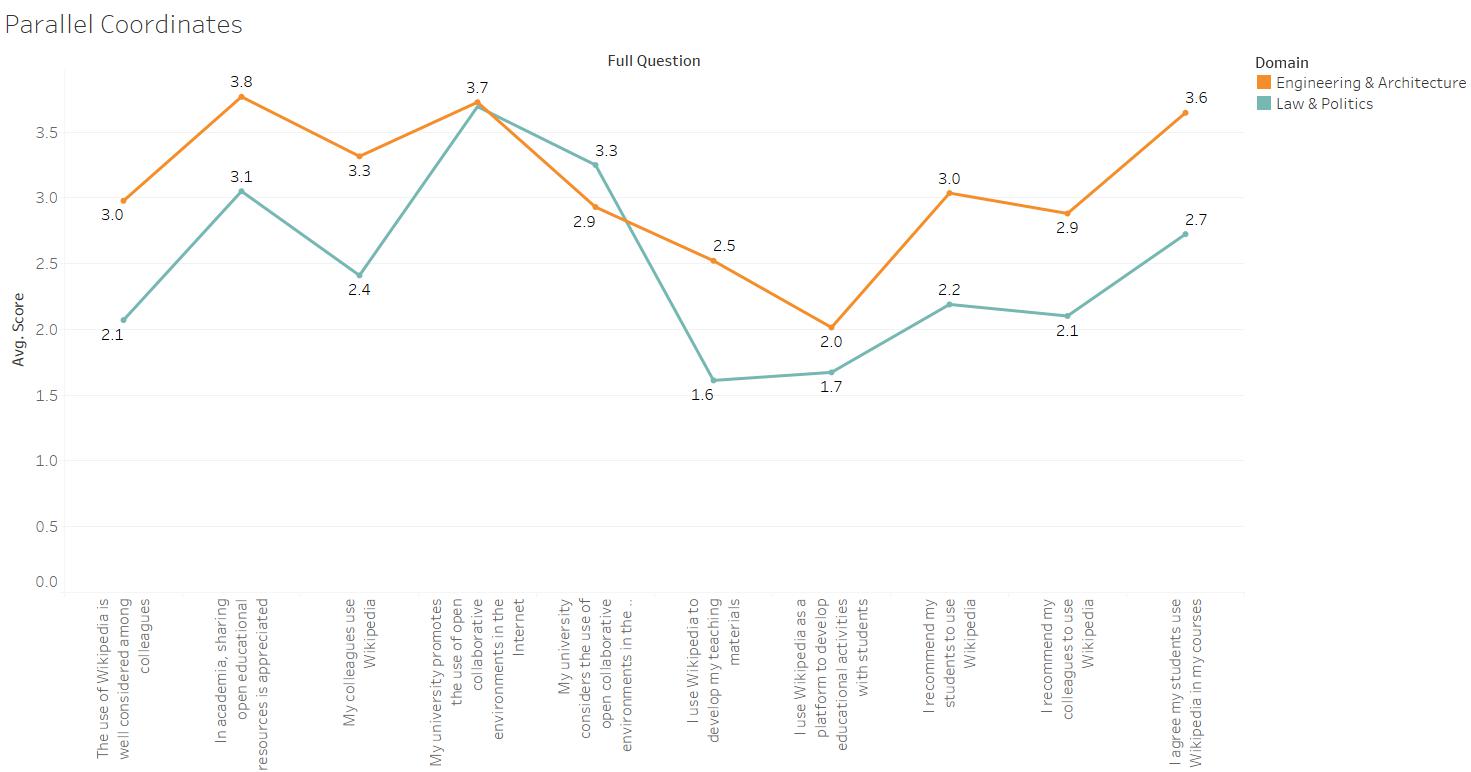
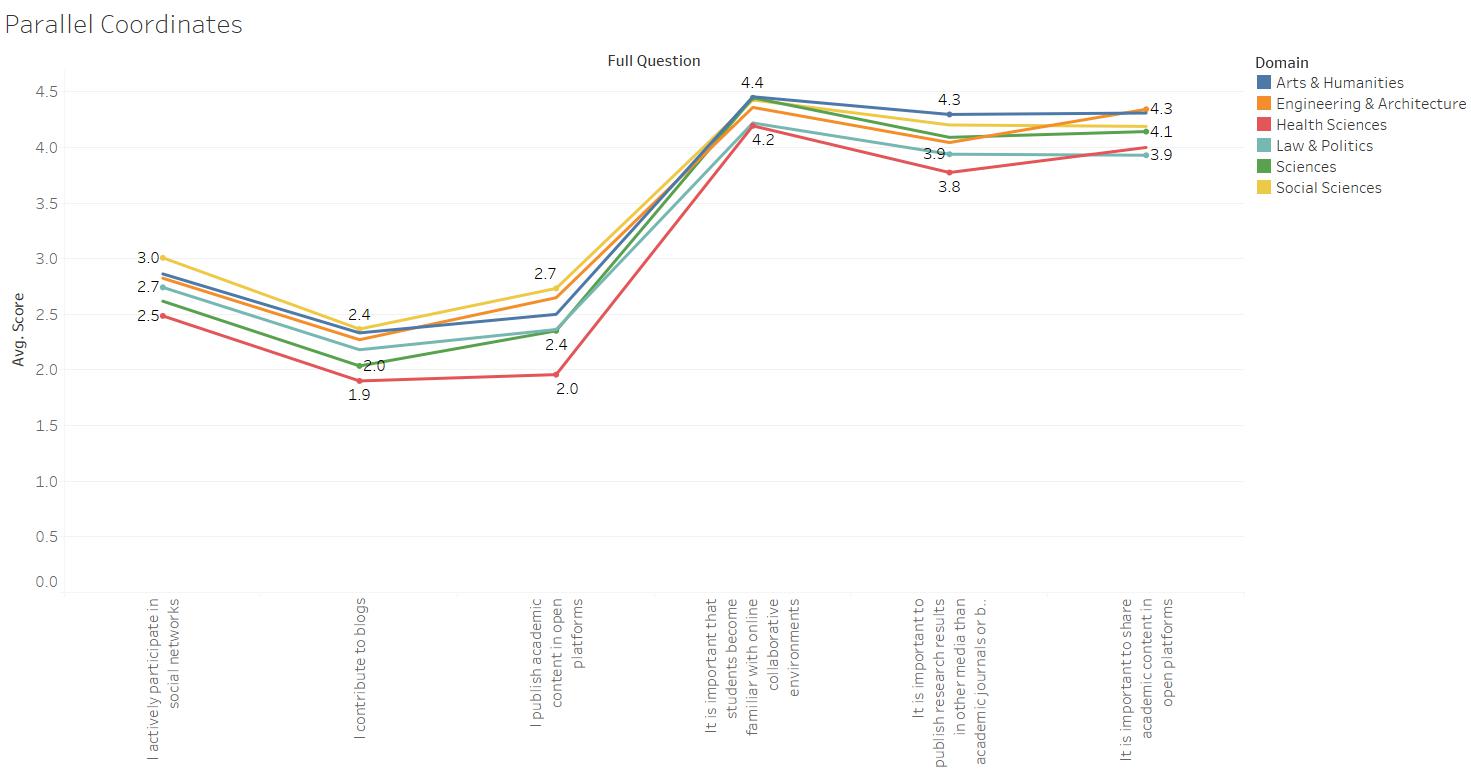
| 14:13, 26 September 2016 | Parallel Coordinates Socail Image and JR vs Use.jpg (file) |  |
72 KB | Average Social Image and Job Relevance Score for Engineering & Architecture and Law & Politics | 1 |
| 15:25, 26 September 2016 | Divergent Stacked Bar Chart - Social Media Profile & Sharing Attitude.jpg (file) |  |
80 KB | Divergent Stacked Bar Chart - Internet Profile & Sharing Attitude | 1 |
| 15:29, 26 September 2016 | Parallel Coordinates Internet Profile & Sharing Attitude.jpg (file) |  |
74 KB | Average Internet Profile & Average Sharing Attitude of all Domain Types | 1 |
| 15:59, 26 September 2016 | Divergent Stacked Bar Chart - PU, PEU, PE.jpg (file) |  |
100 KB | Perception of faculty members on the Perceived Usefulness, Perceived Ease of Use and Perceived Enjoyment of Wikipedia | 1 |
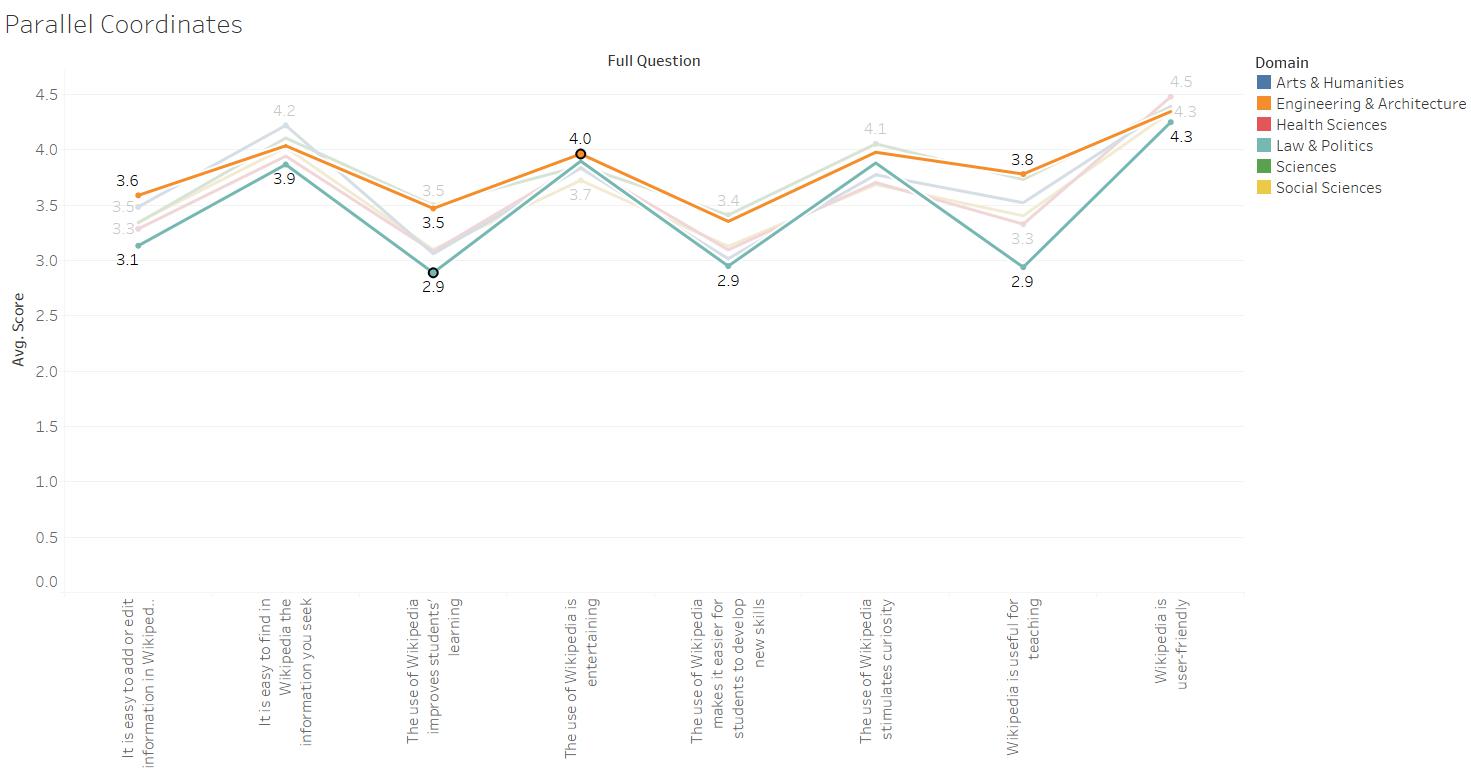
| 16:01, 26 September 2016 | Parallel Coordinates PU,PEU,PE.jpg (file) |  |
70 KB | Perception of faculty members on the Perceived Usefulness, Perceived Ease of Use and Perceived Enjoyment of Wikipedia by Domains | 1 |
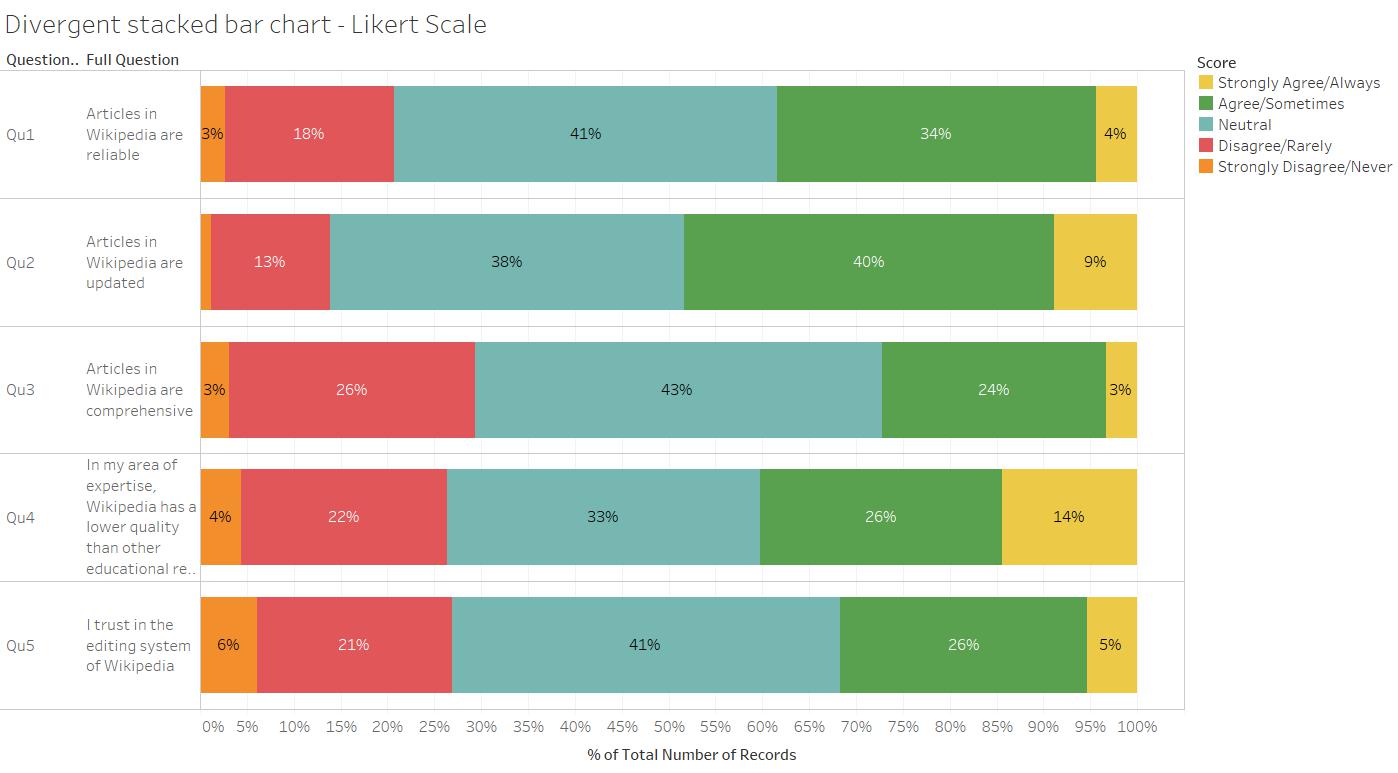
| 17:08, 26 September 2016 | Divergent Stacked Bar Chart - Quality.jpg (file) |  |
89 KB | Divergent Stacked Bar Chart: Perception of faculty members on quality of Wikipedia | 1 |
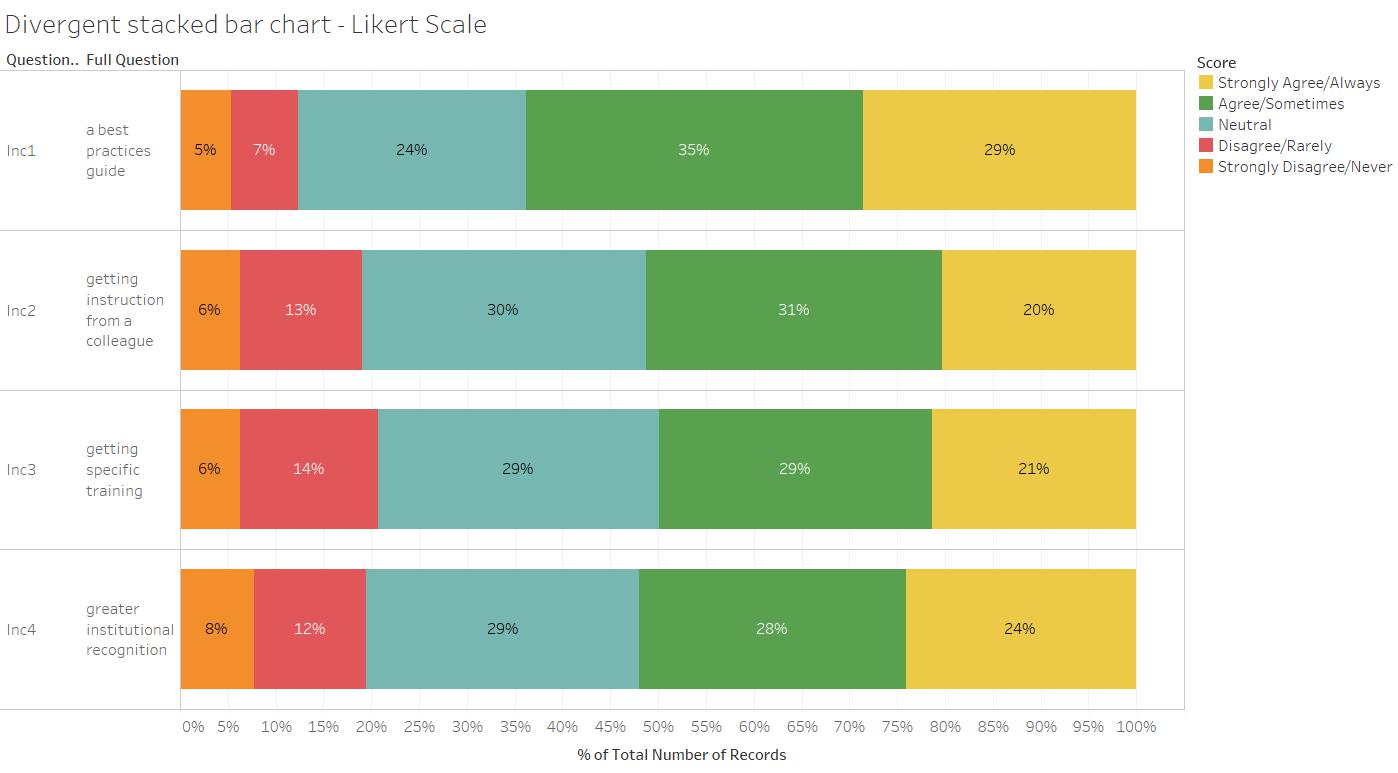
| 17:42, 26 September 2016 | Divergent stacked bar chart - Incentives to use Wikipedia.jpg (file) |  |
77 KB | Incentives to design educational activities using Wikipedia | 1 |
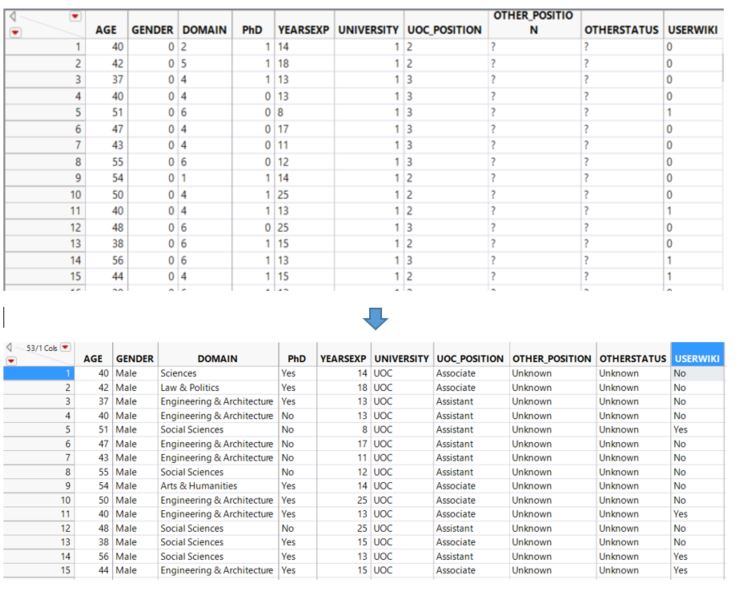
| 01:16, 27 September 2016 | Data Cleaning - Numeric to Categorical.JPG (file) |  |
77 KB | Data Preparation: Converting Numeric Codes to Categorical Strings | 1 |
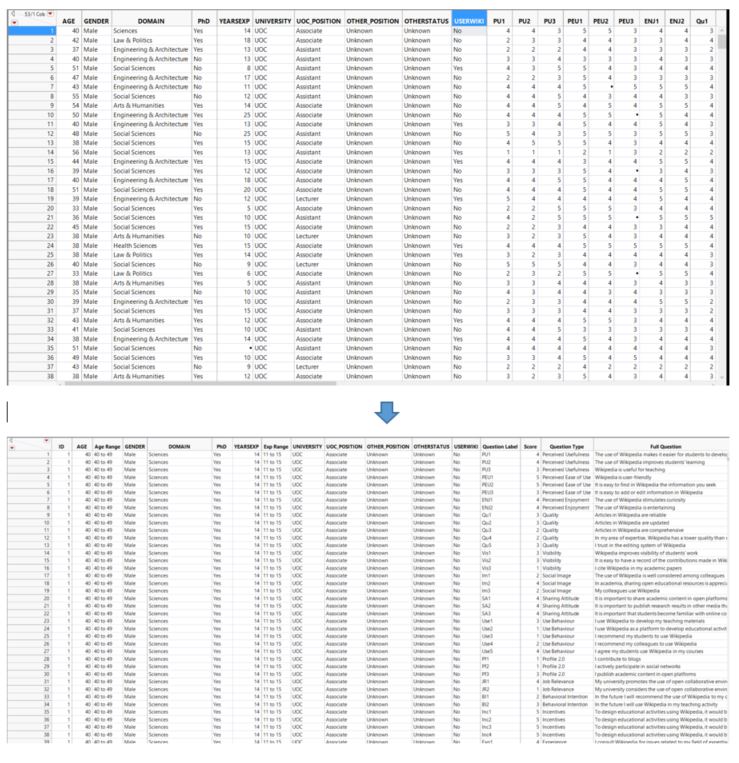
| 01:28, 27 September 2016 | Data Cleaning - Stacking.JPG (file) |  |
117 KB | Data Preparation: Stacking | 1 |
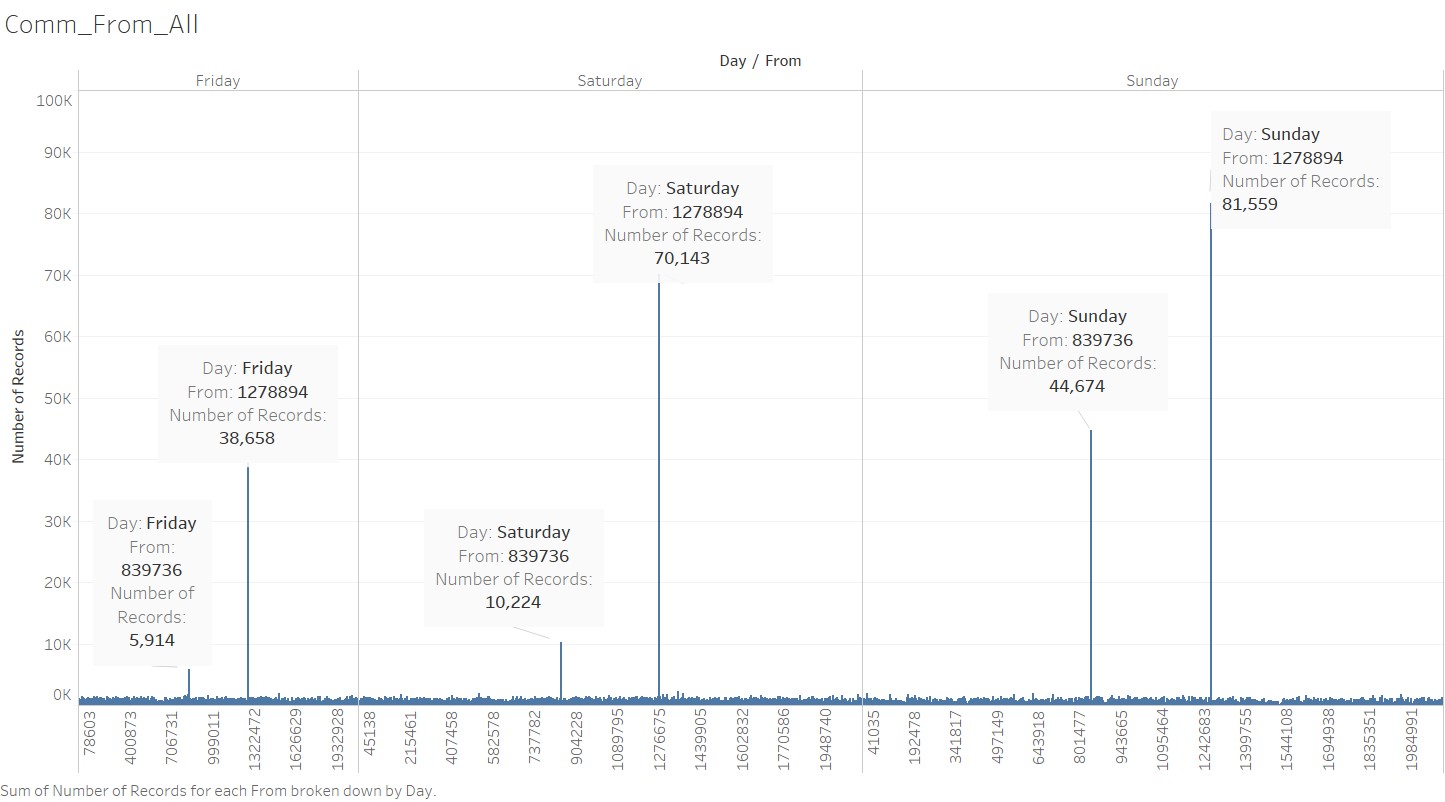
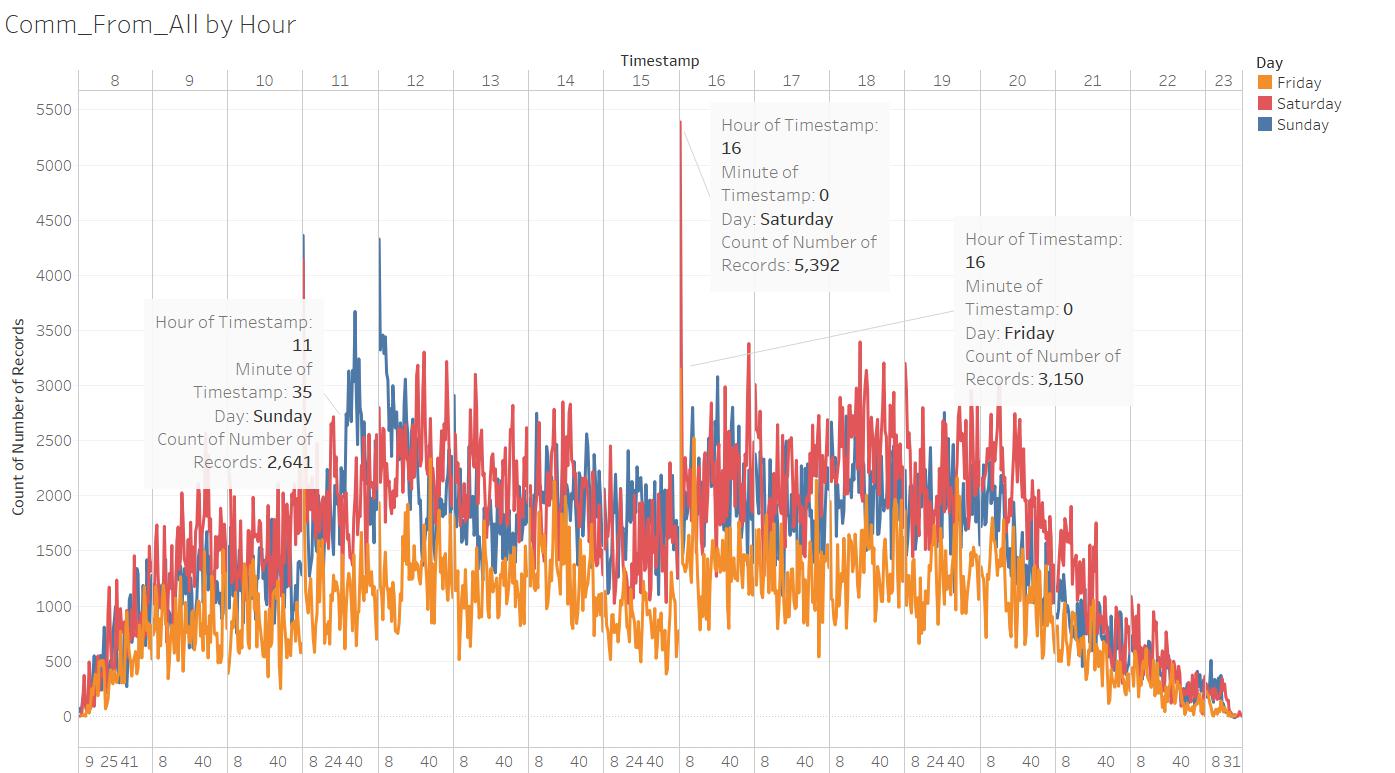
| 12:33, 28 October 2016 | Comm From All.jpg (file) |  |
126 KB | Communications Volume across three days | 1 |
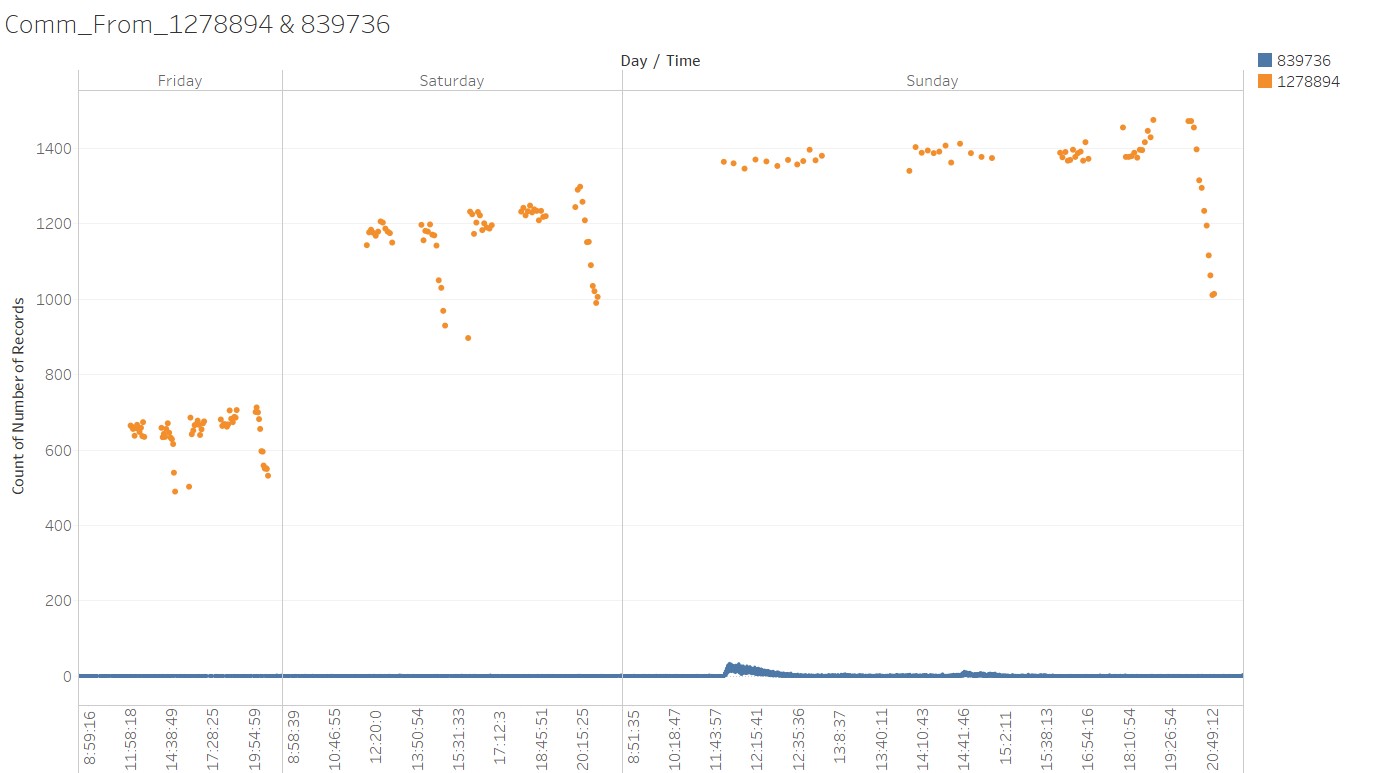
| 12:43, 28 October 2016 | Comm From 1278894 and 839736.jpg (file) |  |
87 KB | Communication Volume Originating from the IDs 1278894 & 839736 | 1 |
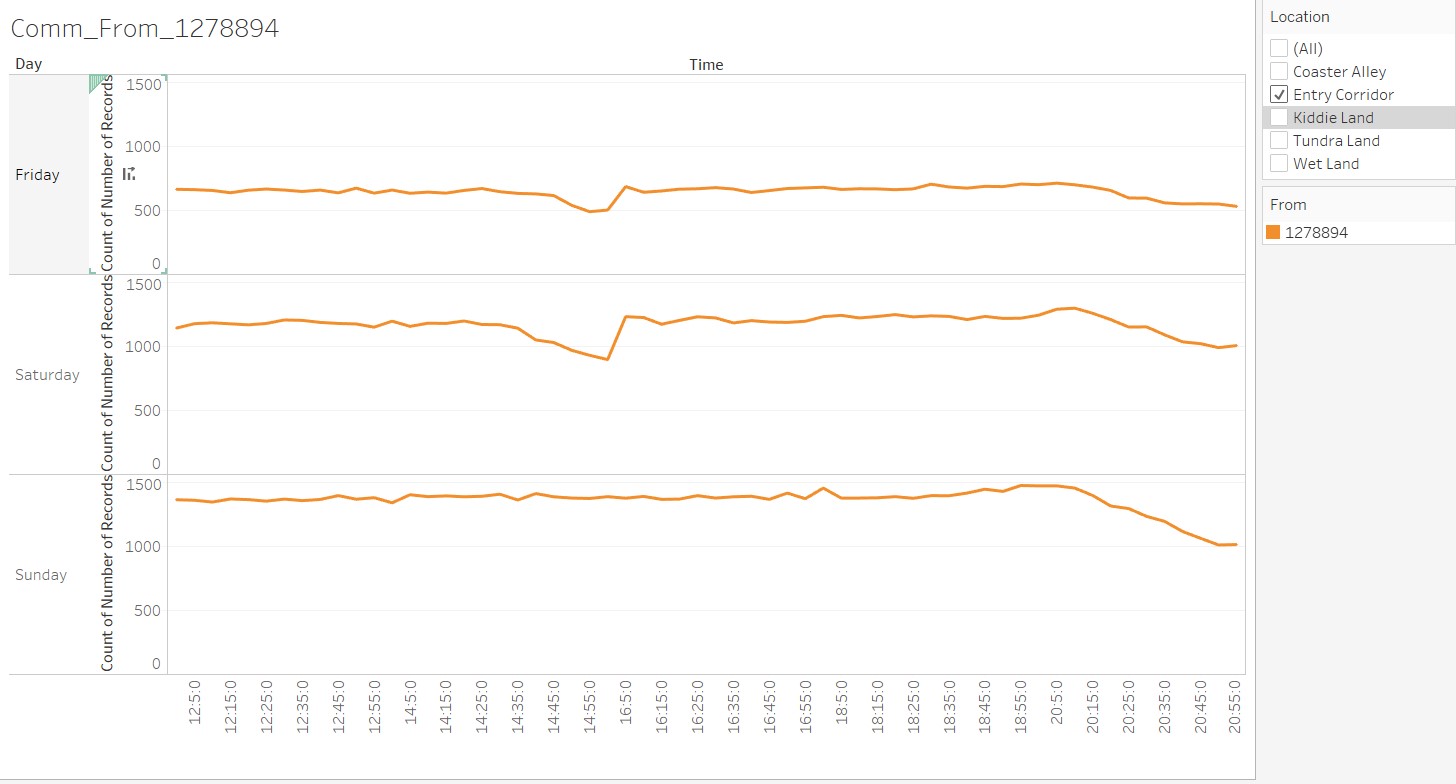
| 12:49, 28 October 2016 | Comm From 1278894.jpg (file) |  |
109 KB | Communication Originating from ID 1278894 | 1 |
| 12:53, 28 October 2016 | Comm From 839736.jpg (file) |  |
124 KB | Communication Originating from ID 839736 | 1 |
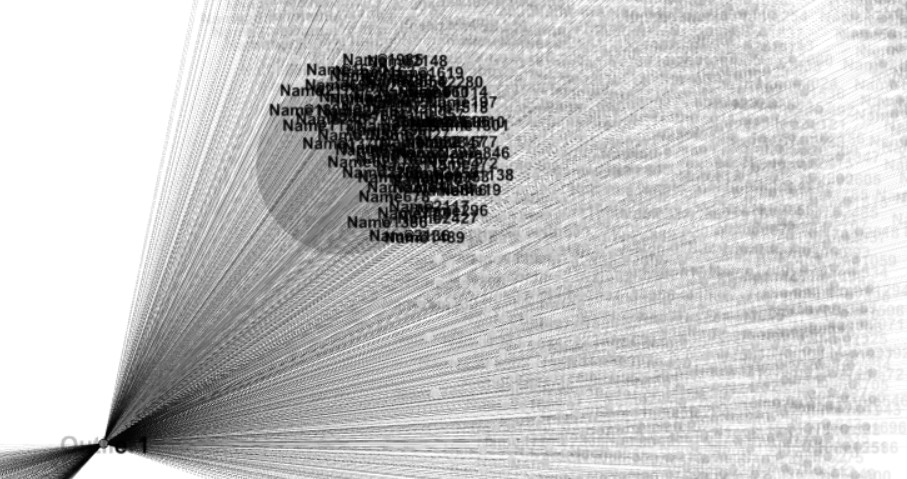
| 13:01, 28 October 2016 | Network Graph 1278894.jpg (file) |  |
132 KB | Network Graph with ID1278894 as the Source | 1 |
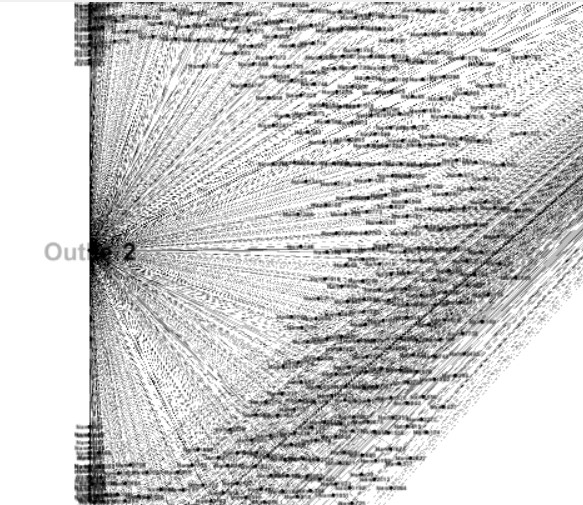
| 13:02, 28 October 2016 | Network Graph 839736.jpg (file) |  |
130 KB | Network Graph with ID 839736 as the Source | 1 |
| 13:23, 28 October 2016 | Comm From All Exclude Outliers.jpg (file) |  |
129 KB | 2 | |
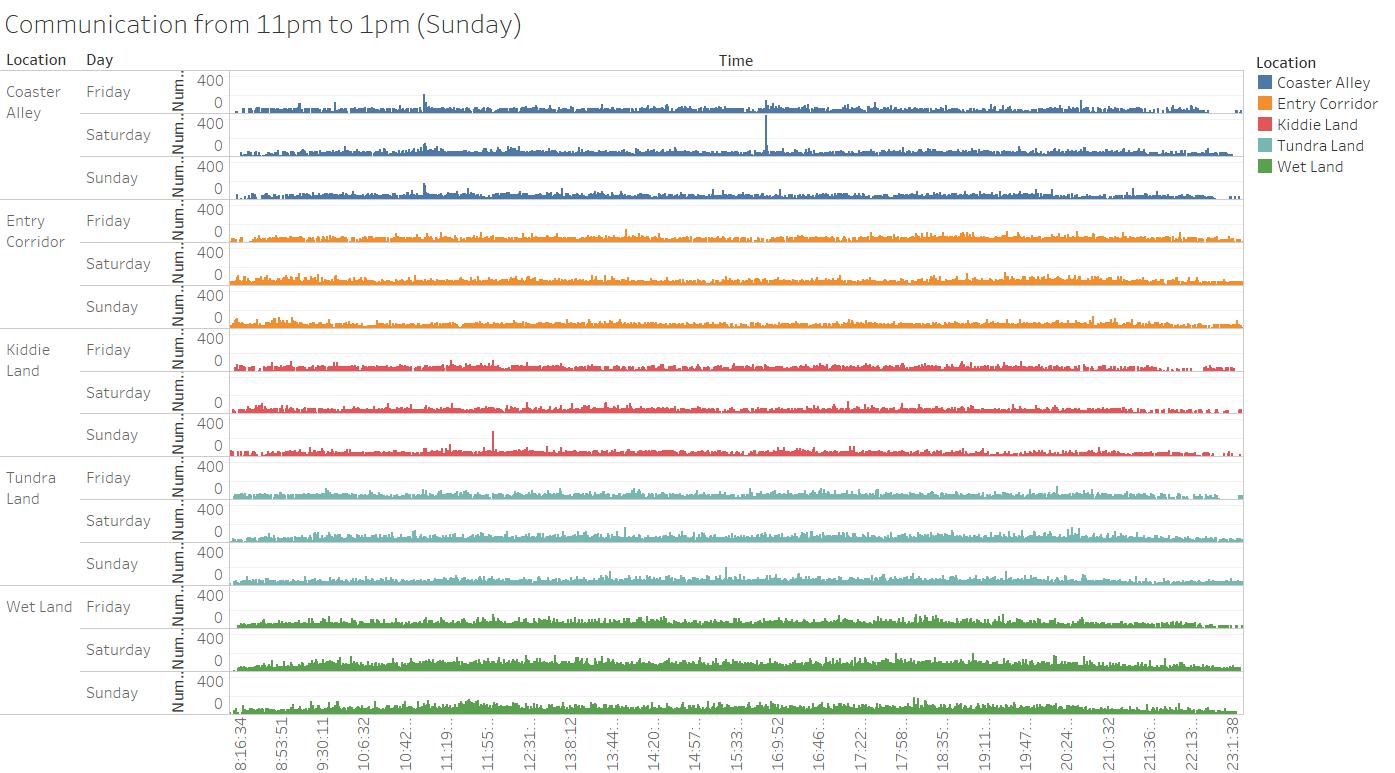
| 13:42, 28 October 2016 | Comm From All Exclude Outliers 2.jpg (file) |  |
160 KB | Communication From All based on time and location with exclusion of outliers | 1 |
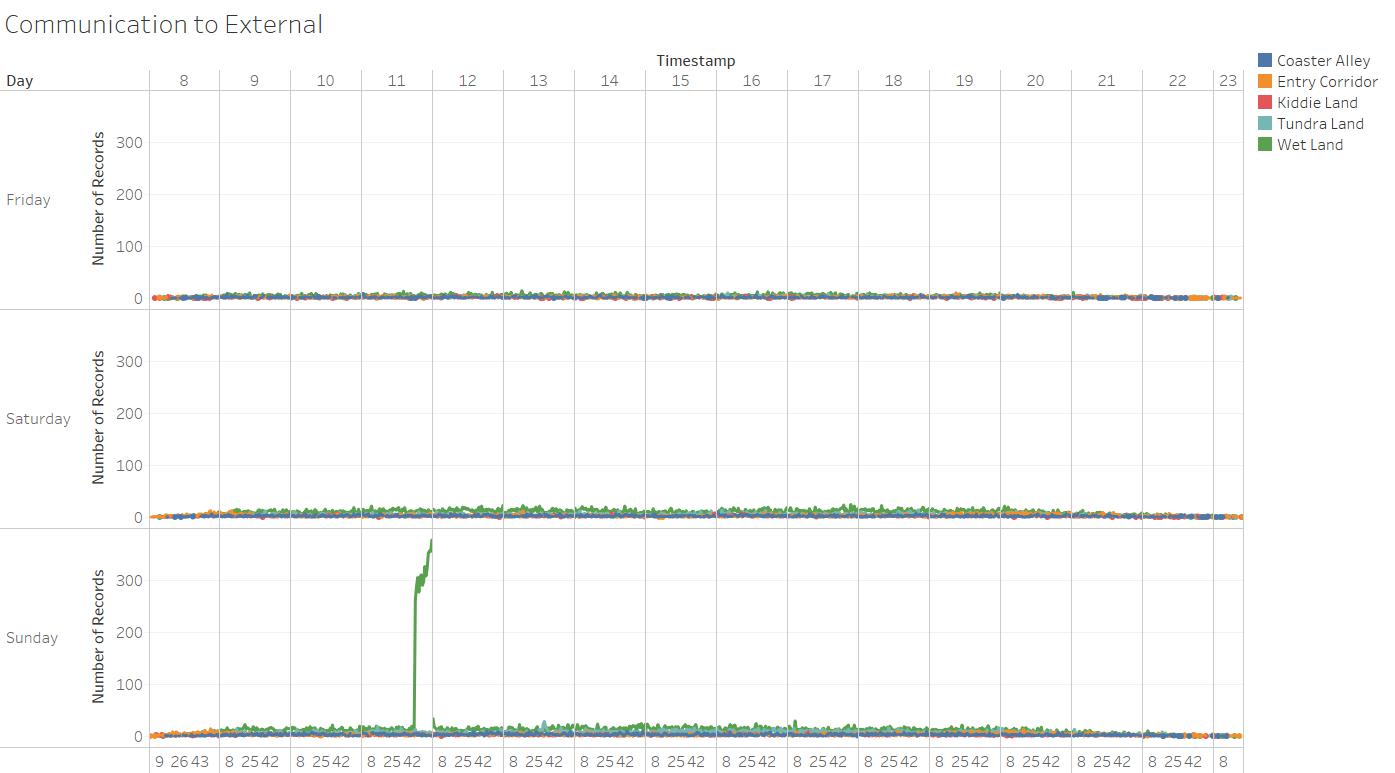
| 21:38, 28 October 2016 | Communication to External.jpg (file) |  |
88 KB | Communication to External | 3 |
| 10:46, 28 November 2016 | Dashboard 1 - HeatMap of World Universities.jpg (file) |  |
107 KB | HeatMap of World Universities (Times Higher Education) by number of universities, international student ratio, student to staff ratio and female to male distribution. | 1 |
| 11:27, 28 November 2016 | Dashboard 2 - Correlation Plot & Average Scoring Criteria Scores.png (file) |  |
116 KB | This Dashboard allows users to review the correlation of the criteria used in the scoring of the total score for the world ranks in the Times Higher Education Study. Users could toggle between regions, year and world ranks. The Y-axis of the correlatio... | 1 |
| 12:43, 28 November 2016 | Dashboard 3 - List of Universities & Scoring Criteria Breakdown.png (file) |  |
141 KB | List of Universities and scores breakdown | 1 |
| 12:52, 28 November 2016 | Dashboard 4 - University World Rank & Scoring Criteria Trend.png (file) | 159 KB | This dashboard allows the users to observe the changes in the world rank and the changes in the scores for each individual scoring criteria over the years. | 1 |