ISSS608 2016-17 T1 Assign2 Ong Han Ying - Introduction
|
|
|
|
|
|
|
|
Section 1: Background
Wikipedia as a learning tool: The launched of Wikipedia in 2001 has definitely changed the way of how one learnt & gain knowledge, by being a source for rich information. Gradually,it has also become a platform that facilitates collaboration for knowledge creation and dissemination. With these functionalities and application, Wikipedia is becoming a popular teaching tool in schools. In fact, a research was conducted in 2015 to explore "Factors that Influence the Teaching Use of Wikipedia in Higher Education" [1]. To facilitate this research, an online survey was conducted; and the dataset (Survey's results) was made available to the public.
About the research paper: The research paper, "Factors that Influence the Teaching use of Wikipedia in Higher Education" was completed by Meseguer, A., Aibar, E., Lladós, J., Minguillón, J., Lerga, M in 2015. In all, 9 research hypotheses were defined by adapting the model of "Technology Acceptance Model 3.0". The results have found that all hypothesized links are not rejected, and are active within the internal factor of the model.
To facilitate the research paper, an online survey was also conducted with 913 faculty members at the Universitat Oberta de Catalunya (UOC), and Universitat Pompeu Fabra (UPF) in Spain. There are mainly 3 type of information collected, as below;
- About the respondents in terms of Personal Profile, and Teaching Profile
- Identify if the respondents have a registered Wikipedia account or not
- Survey results, based on 43 survey questions, and 13 categories
The Survey items are on a Likert scale of "1 to 5", ranging from (1) Strongly Disagree, to (5) Strongly Agree.
Section 2: Objective of Visual Analysis
Multiple stakeholders in the decision-making on the deployment of a teaching tool: For any schools, to decide if a teaching tool should be deployed is never a decision of a single party. Many times, key stakeholders such as the teaching staff and the Representative of the IT Team will need to discuss if the tool were relevant, and if there were resources in the school to support the tool. A third party such as the software company or in this context; Wikimedia Foundation; will also be keen to participate in this decision-making process so as to influence the school to use the tools; so as to increase the number of users using Wikipedia. Therefore, it is of interest to
- The Teaching Staffs
- Manager of the IT Team
- Wikimedia Foundation
to (1) learn more about others' feedback on Wikipedia as a teaching tool, and (2) if the statistical findings from the research conducted are conclusive or there might be more insights and/or exceptions to the conclusion by the research paper. Both objectives can be achieved through visual analytics. With both, the analysis is able to help the stakeholders to
- Drive actionable work-related decisions through learning from the feedbacks of the existing users
- To determine if the statistics findings from the research paper are sufficient to support the factors that affect the deployment of Wikipedia as a teaching tool
2.1: Why Visual Analytics?
Visual analytics is chosen because it helps the stakeholders to start their analysis with a overview in mind, explore and interact with the graphic to explore and discover the unexpected aspect of the data further, and then; zoom into the details when necessary. This is a suitable analysis methodology to meet the objective because it is unlikely for the readers to have all their questions ready, but questions only came about when they embark on the discovery process with the data. Therefore, an interactive graphic is the ideal choice to facilitate this communication between the story of the data to the users. In all, visual analytics help to users to apply Shneiderman (1996) mantra of "Overview first, zoom and filter, then details-on-demand".
Section 3: Initial Questions from the Stakeholders
As above, there are 2 objectives in conducting this visual analytic project. The initial questions arose from the objectives are as below;
3.1: Objective 1 - Gather Feedbacks from Users on Wikipedia as a Teaching Tool
While the 3 identified key stakeholders have the same objective of gathering feedbacks from the users, in using Wikipedia as a teaching tool, all the 3 stakeholders will have different initial questions in mind; due to the different in their work objective. Therefore, different visualization solution has to be proposed to them, so as to support their needs. As such, it is important to identify their initial questions separately, as below;
3.1.1: Version 1 - From the Teaching Staffs
| Why are they keen on it? | How does the analysis help them? |
|---|---|
|
|
3.1.2: Version 2 - From the Manager of IT Department
| Why are they keen on it? | How does the analysis help them? |
|---|---|
|
|
3.1.3: Version 3 - From Wikimedia Foundation
| Why are they keen on it? | How does the analysis help them? |
|---|---|
|
|
3.2: Objective 2 - To Identify Further Insights to the Conclusion of the Research Paper
Next, all the 3 key stakeholders will be keen to validate if the research conducted are conclusive or there might be further insights and/or exceptions to the conclusion by the research paper because;
- Wikimedia Foundation: understanding the factors that influence users to use Wikipedia as a teaching tool will help them to identify the area(s) to focus their improvement on, so as to convert more people into users and/or registered users.
- IT Manager of IT Department: Understanding the factors that influence users to use Wikipedia as a teaching tool will help to identify how to facilitate and allocate resources if the management decided to implement Wikipedia as a teaching tool in the school.
- Teaching Staffs: to understand why other teaching staffs are keen to use Wikipedia as a teaching tool
3.2.1: Why is it Important?
"Conventional Wisdom about what matters is not always grounded in statistical science." [3] In fact, The Huffinton Post's senior data scientist and senior polling editor has considered statistics like "margin of error" as "ethical lapse" - whether it is being considered to analyze the results of an online survey.
In addition, the research paper has applied inference by using a small sample to make a general statement about the population. This sample may not be reflective, especially if drill down into the different segment or profile of the respondents.
Therefore, objective 2 will also help us to identify further insights and exceptions from conclusions of the research paper, focus the resources on them based on further segmentation of the survey results. These will then help the 3 key stakeholders to zoom in, filter and focus on further details of the factors that influence Wikipedia as a teaching tool.
Section 4: Visual Analytic Modelling Strategy
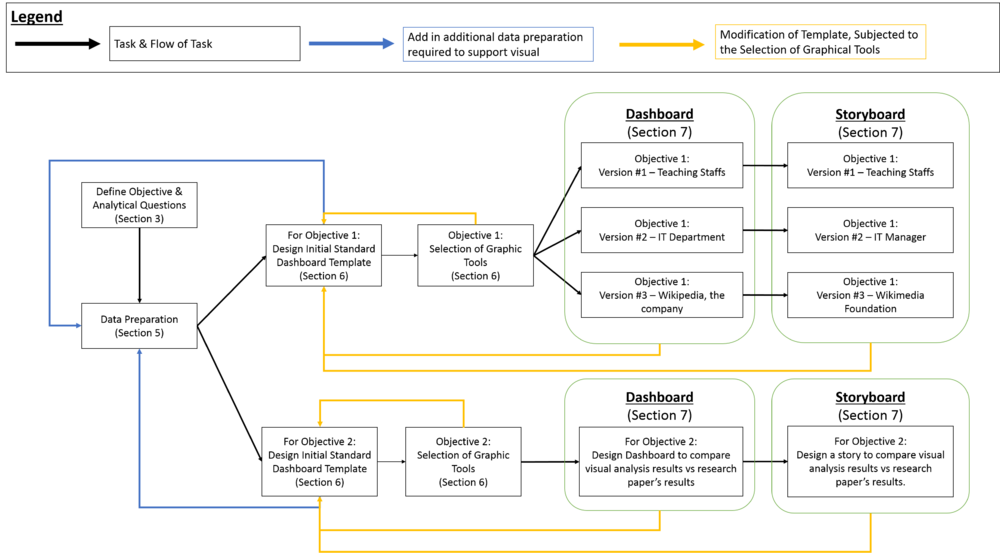
The overall modelling strategy as depicted below;
It is important to note that the designing of a visual analytics is similar to that of the design thinking concept, where platforms are never a sequence of orderly steps, but a system of "overlapping spaces", a cyclical process till a satisfied version is obtained.


