IS428 2016-17 Term1 Assign3 Lim Ting Zhi
Jump to navigation
Jump to search
Contents
Task
The problem and motivation of this analysis is found here. The main task is to help GAStech to understand its operations data and answer the following questions.
- What are the typical patterns in the prox card data? What does a typical day look like for GAStech employees?
- Describe up to ten of the most interesting patterns that appear in the building data. Describe what is notable about the pattern and explain its possible significance.
- Describe up to ten notable anomalies or unusual events you see in the data. Prioritize those issues that are most likely to represent a danger or a serious issue for building operations.
- Describe up to five observed relationships between the proximity card data and building data elements. If you find a causal relationship (for example, a building event or condition leading to personnel behavior changes or personnel activity leading to building operations changes), describe your discovered cause and effect, the evidence you found to support it, and your level of confidence in your assessment of the relationship.
Data Preparation
1. Hazium Concentration Datasets
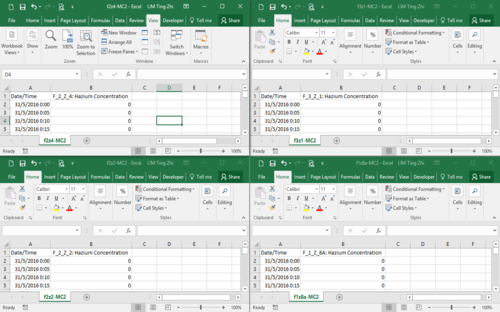
| There is a total of four datasets for the same information, hazium concentration, but it is for four different floors and zones. Thus, there is a need to combine these four datasets into one by using JMP Pro. | |
| Using the ‘Join’ function and matching the ‘Date/Time’ columns, I have joined the four tables into one table and the result is as shown. | |
| After which using the ‘Stack’ function, I have stacked the four hazium concentration columns and the result is as shown. | |
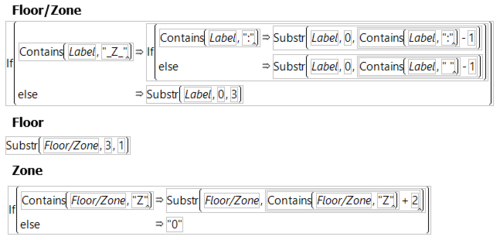
| To retrieve the floors and zones information, I have used the formulas as shown to create three new columns, Floor/Zone, Floor and Zone | |
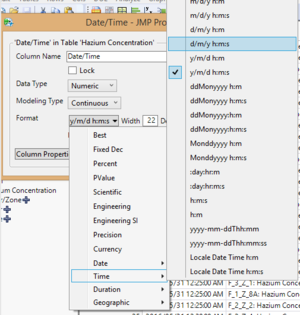
| As Tableau date format is different from JMP Pro, I have changed the format for ‘Date/Time’ using the settings as shown. | |
| Here is a snapshot of the result. |
2. Building Dataset
| There is a total of 416 columns in the raw data and many attributes are for different building elements information on an overall building level, floor levels and floor/zone levels. A snapshot is shown on the left. | |
| Using the ‘Stack function, I have stacked the attributes on the floor levels and floor/zone levels. | |
| To retrieve the floors and zones information, I have used the formulas as shown to create three new columns, Floor/Zone, Floor and Zone. Those building elements information that are on a floor level, I have let zone be equal to 0. | |
| To retrieve the building element, I have used the formula as shown. However, there is some re-coding that needed to be done. | |
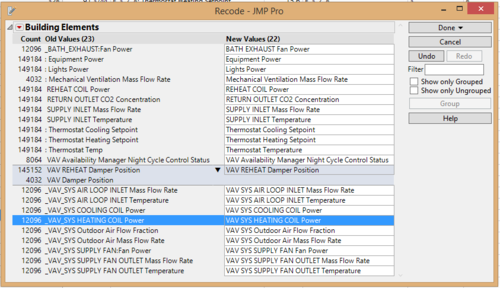
| Using the ‘Recode’ function, I have removed the spaces, under-scores and semicolons wherever they are unnecessary. I have group VAV Damper Position and VAV Reheat Damper Position as they both mean the same thing. | |
| For the remaining overall building level information, I have used the ‘Stack’ function similar to previous steps and the result is as shown. | |
| Using the ‘Concatenate’ function, I then join the two tables together and here is a snapshot of the result. |
3. Employee Dataset
| There is no information about the floor or zone that the employee’s office is at and no information on his Prox ID. | |
| Using the proximity floor maps given, I have mapped the floor and zone accordingly using the employee’s office. For the Prox-Id, in general, it is the first alphabet from the first name and concatenating it with the last name. Then adding a ‘001’ behind it which to determine the different cards that employee has. In some scenarios, there are multiple Prox-Id for one employee and some employee’s first name could have certain special characters. |
4. Proximity Floor Maps
| I have firstly remove the white spaces for each of the proximity floor maps. | |
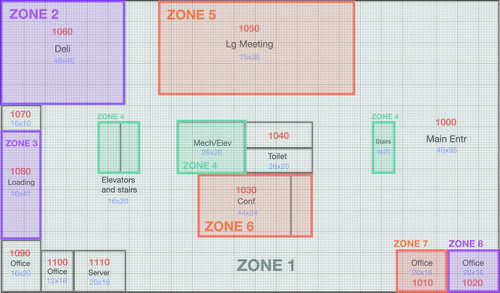
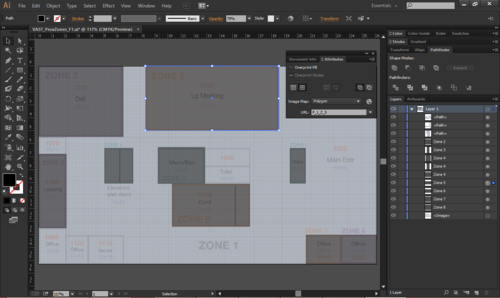
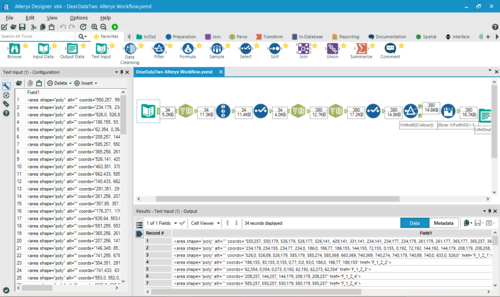
| By following the tutorial (http://www.theinformationlab.co.uk/2015/11/11/creating-polygons-of-any-image-in-tableau/) and using the tools, Adobe Illustrator and Alteryx, I have plotted the proximity floor maps into X and Y coordinates. Here are some snapshots of the process and the final dataset. |
Final Visualisation
Final Visualisation Link: https://public.tableau.com/profile/publish/LimTingZhi-VAAssignment3/GAStechOperationDataAnalysis
Uploaded on Elearn.
Questions
1. Typical Patterns in Proximity Card Data & GAStech Employees’ Typical Day
Typical Patterns in Proximity Card Data
| No. | Visualisations | Anaysis |
|---|---|---|
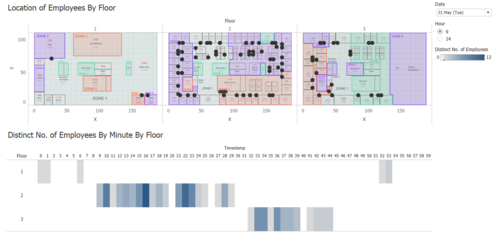
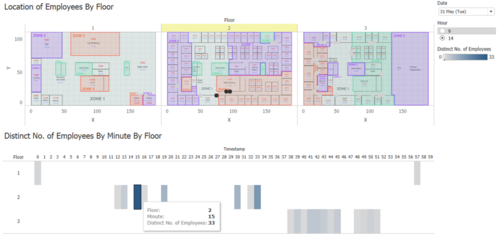
| 1. | For the mobile proximity data, the robot, Roise, moves at 9am to 10am and 2pm to 3pm daily and only on the weekdays. In general, at 9am, the employees at their offices and at 2pm, majority of the employees are at the conference or meeting/training room at the 2nd floor. | |
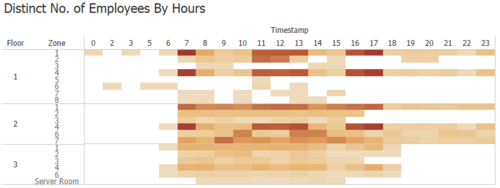
| 2. | For the fixed proximity data, it collects everyday on a 24-hours basis. However, there is no data collected on 4 June, Saturday. In general, there are no employees during 12am midnight to 6am at the 2nd and 3rd floors and also no employees after 7pm at the 3rd floor. |
GAStech Employees’ Typical Day
| No. | Visualisations | Anaysis |
|---|---|---|
| 1. |
|
Patterns For Each Department
| No. | Department | Anaysis |
|---|---|---|
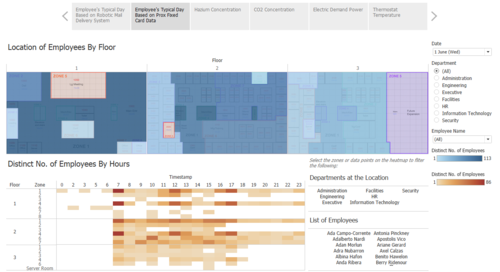
| 1. | Administration | Employees usually follow the typical pattern of arriving to work at 7am, going to lunch at 12noon and leaving at 5pm. |
| 2. | Engineering | Employees come in at 7am and most of them will leave at 5pm. However, Clemencia Whaley, Penney Bueno and Twana Quiroz seems to leave at 11pm. Furthermore, employees only move in the 1st and 2nd floors. |
| 3. | Executives | Employees typically come in at 7am and will leave by 7pm. They also seem to go for lunch earlier at 11am. CEO Sten Sanjorge Jr. seems to be coming in to work earlier than the rest at 6am. |
| 4. | Facilities | Employees are seen throughout the whole day. They tend to stay around late and will leave either by 5pm or 12am. From 12am to 6am, Varro Awelon and Emile Arpa are the only ones that will stay in the building. Furthermore, it can be seen that they will leave at 7am. |
| 5. | HR | Employees follow the typical pattern of arriving to work at 7am and leaving at 5pm. They would go to Deli during their lunch time at 11am. |
| 6. | Information Technology | Employees are seen to be at the 1st and 2nd floor from 7am to 12am midnight and at the 3rd floor from 9am to 5pm. This is because this is no office for the IT department in the 3rd floor. Employees are probably there to help other departments to solve their IT issues. |
| 7. | Security | Employees usually follow the typical pattern of arriving to work at 7am, going to lunch at 12noon and leaving at 5pm. They have more movement on the 1st and 2nd floors. |
2. Interesting Patterns in Building Data
| No. | Visualisations | Anaysis |
|---|---|---|
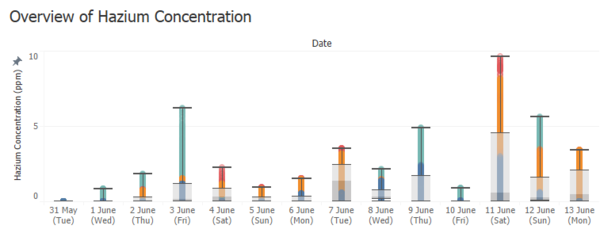
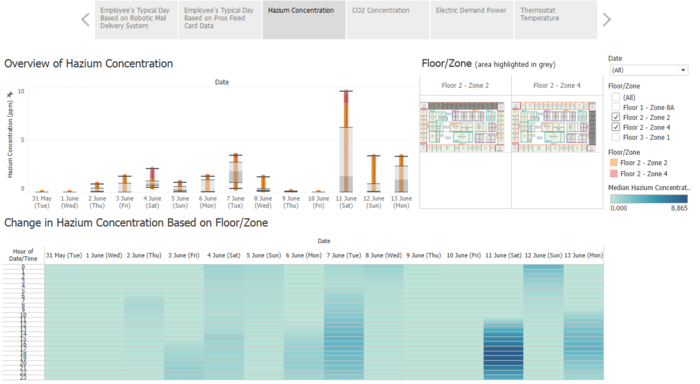
| 1. | Looking at the overview for Hazium concentration, it can be seen that the median is always low expect for 7 June, which the relatively high. The distribution of Hazium concentration varies quite widely and it go up to the highest value near to 10ppm. The highest point is at 11 June. Although the sensors are only at 4 different zones, the Hazium concentration is important as it is possibly dangerous chemical. It could also affect other zones. | |
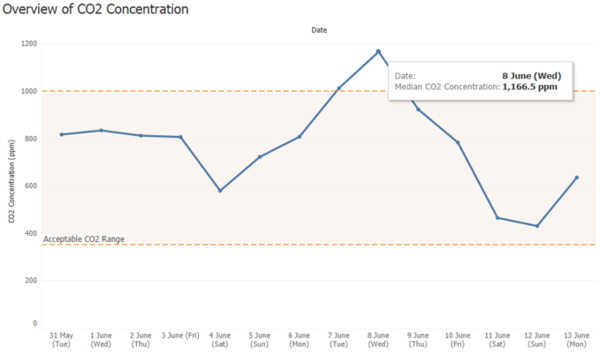
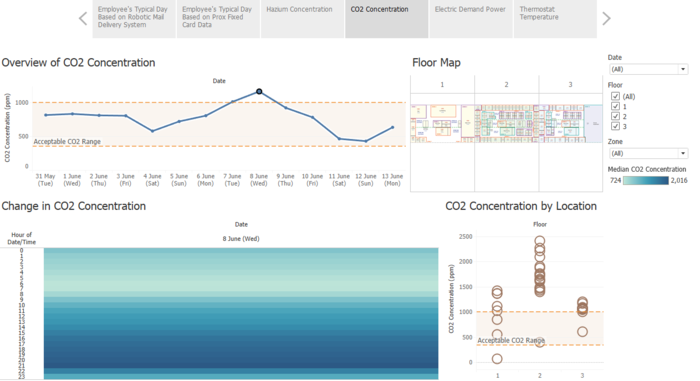
| 2. | Looking at the overview for CO2 concentration, it can be seen that the median is relatively constant for the first few days. Then, the median starts to gradually increase after a little drop. It reaches the highest point on 8 June, which is out of the acceptable CO2 range of 350ppm to 1,000ppm. After which is goes back to the acceptable range for the next few days. The CO2 level is important as any value above 1,000ppm could start to cause drowsiness, headaches or poor concentration. An increase in CO2 will affect the productive and the welfare of the employees. | |
| 3. | Looking at CO2 concentration by location, it can be seen that the median CO2 concentration for some zones in the 2nd floor is above the acceptable level and zones in 3rd floor is relatively the same. The CO2 level is important as mentioned above. Furthermore, there is a lot of employees in the 2nd floor and it may affect their health. | |
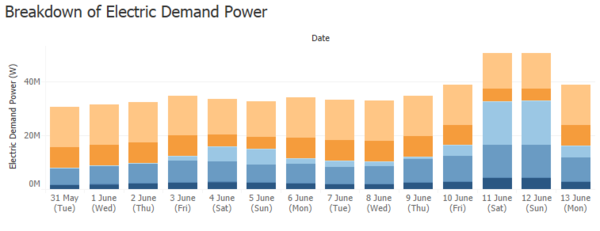
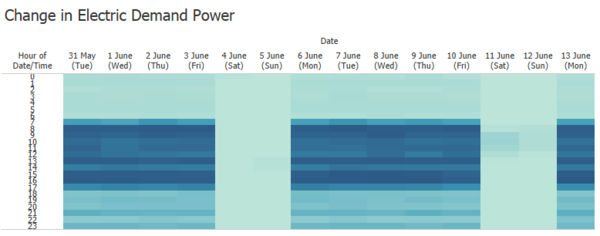
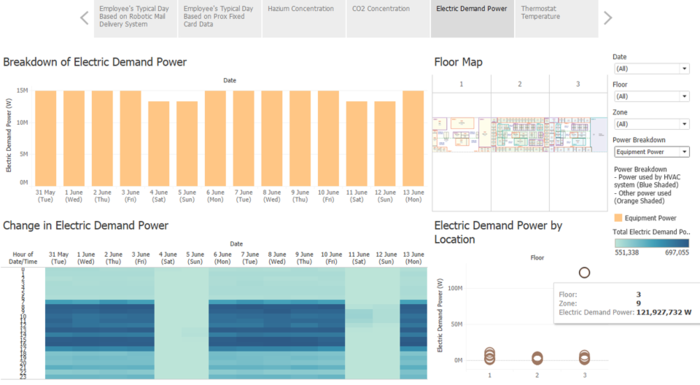
| 4. | Looking at the breakdown of electric demand power, it can be seen that there is a constant usage of total power throughout the days. For the HVAC system’s power usage (shaded in blues), it can be seen there is an increase in reheat coil power (light blue) on 11 June and 12 June. The power usage is important as GAStech need to make sure that they are not spending extra money on unnecessary power usage. | |
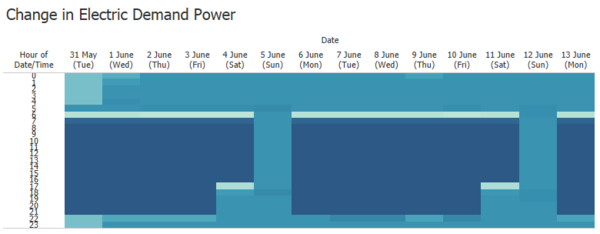
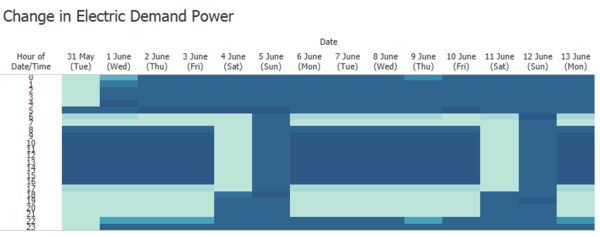
| 5. | Looking at the change in electric demand for bath exhaust fan power, it can be seen there is a distinct pattern whereby it roughly uses the same power for each week. If there are any unusual patterns in the future, it could mean that there is something wrong with the system. | |
| 6. | Looking at the change in electric demand for deli fan power, this is similar to the bath exhaust fan power. There is a distinct pattern whereby it roughly uses the same power for each week at the same timings. | |
| 7. | This also goes the same to the usage of equipment power and light power. The high usage is during the 8am to 7pm and only on weekdays. | |
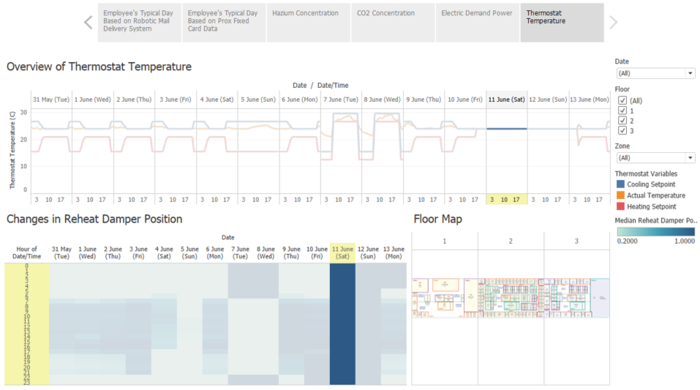
| 8. | Looking at the overview of thermostat temperature, for the first few days, there is a pattern whereby the heating set point (red) increases when the cooling set point (blue) decreases. Furthermore, both points have no change if the other don’t move. However, after 4 June, there seems to be a few different patterns and during 11 June to 12 June, the temperatures are at the same point. This is important as previously there is increase in power on 11 and 12 June, there could be something wrong with the system. Thus, causing a waste of energy usage. |
3. Unusual Events
| No. | Visualisations | Anaysis |
|---|---|---|
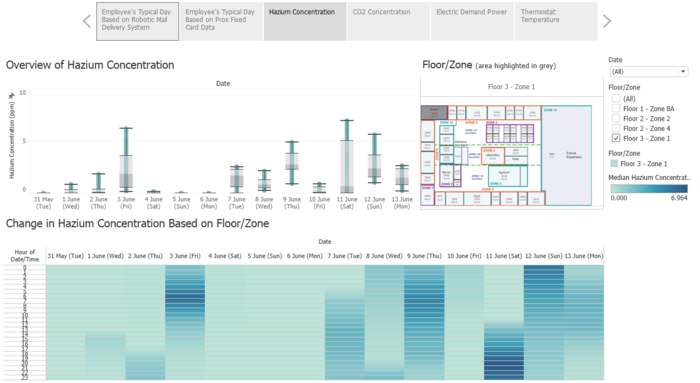
| 1. | On the 3rd floor at zone 1, it can be seen that there is high amount of Hazium concertation especially on 3 June, 9 June, 11 June and 12 June. This is important as the Hazium is a possibly dangerous chemical and zone 1 is particularly for one office. There could be a possibility that the chemical is spreading to other zones near zone 1 and it is undetected at the moment. | |
| 2. | As mentioned earlier, the highest point for Hazium concentration is at 11 June. The high amount of Hazium concentration at 11 June is mainly due to the zones at the 2nd floor. It can be seen that there is high amount from 4pm to 9pm. Although the spike is during a Saturday which is off-working hours, these two zones are all offices. One reason could be due a fault in the sensors which will affect the building operations. | |
| 3. | As mentioned earlier, the highest point for CO2 concentration is on 8 June, which is out of the acceptable CO2 range of 350ppm to 1,000ppm. Looking in detail, the CO2 concentration is gradually increasing throughout the day. After 9am, it was over the acceptable level of 1,000ppm. This is the time where employees are working and a high CO2 concentration level will cause them some problems such as drowsiness, headaches or poor concentration. It can also be seen that majority of the zones in all floors are over the acceptable level. Although the level of CO2 depends on various factors, it is important to make sure the CO2 is at the acceptable level for the welfare the employees. | |
| 4. | As mentioned, on 11 June and 12 June, the temperatures are all the same. This could be because of the reheat damper position is fully open for the whole day. Thus, causing a high usage of power for two days. This issue may not likely to represent a serious issue for the building operations but it should be taken care off, so it will not cause extra expenses for the GAStech. | |
| 5. | For the change in electric demand for equipment power, the total power usage throughout the weekdays is near 15 million watts and for weekends is around 13 million watts. The high usage of equipment power comes from the 3rd floor in zone 9 which is the server room. As server rooms will need a lot of power, thus, this is not likely to represent any serious issue to the building operations. |
Tools Utilized
The following tools were utilized during the analysis:
- Microsoft Excel 2016
- JMP Pro 12
- Tableau 10.0
- Adobe Illustrator
- Alteryx
References
- Creating Polygons Of Any Image In Tableau - http://www.theinformationlab.co.uk/2015/11/11/creating-polygons-of-any-image-in-tableau/
- Alteryx Software - http://www.alteryx.com/?_ga=1.175594402.1034301483.1477128882
- Dynamically Switch Images Using Filter - https://community.tableau.com/thread/119079
- CO2 Safe Levels - https://www.kane.co.uk/knowledge-centre/what-are-safe-levels-of-co-and-co2-in-rooms
- Tableau: Good to Great; Hiding Options in Quick Filters - http://www.theinformationlab.co.uk/2015/06/17/tableau-good-to-great-hiding-options-in-quick-filters/
