IS428 2016-17 Term1 Assign2 Tee Yu Xuan
Contents
- 1 Theme of Interest
- 2 Problem and Motivation
- 3 Questions for Investigation
- 4 Investigation
- 4.1 Q1. Which are the industries with the highest number of workplace injuries? Is the industry with the highest injury, also the one with the highest major injuries?
- 4.2 Q2. Which are the occupations with the highest number of workplace injuries?
- 4.3 Q3. Which body parts are most commonly injured?
- 4.4 Q4. Is there any relation between the body part injured and the industry? (Food&Beverage = more injuries to hands?)
- 4.5 Q5. Are the injuries self inflicted or through external causes?
- 4.6 Q6. Is there any relationship between working overtime and the injuries?
- 4.7 Q7. Is there any relationship between amount of manual work in the job and the injuries? (higher % of manual work, higher risk?)
- 4.8 Q8. Is there any relationship between accident categories and industry/occupation?
- 5 Conclusion/Results
- 6 Tools Utilized
- 7 Comments
- 8 References
Theme of Interest
The theme selected in this project is regarding the workplace injuries happening in Singapore. The data being used is provided by Workplace Safety and Health Institute (WHS) for the Year of 2014.
Problem and Motivation
Safety has always been a huge concern for everyone, with the media focusing its attention on health issues such as viruses (Zika etc.) and even terrorist attacks, we often forget about the safety of the place we spend the most time at (other than our homes), the workplace.
Are the safety measures put in place by employers sufficient in preventing such incidents? What are the most common workplace incidents in Singapore? How can we minimize to our best ability the workplace hazards that might causes these injuries? This project aims to answer some of these questions with the Workplace Injuries Report 2014 and provide some insights on the workplace safety conditions in Singapore.
Questions for Investigation
- Which are the industries with the highest number of workplace injuries? Is the industry with the highest injury, also the one with the highest major injuries?
- Which are the occupations with the highest number of workplace injuries?
- Which body parts are most commonly injured?
- Is there any relation between the body part injured and the industry? (Food&Beverage = more injuries to hands?)
- Are the injuries self inflicted or through external causes?
- Is there any relationship between working overtime and the injuries?
- Is there any relationship between amount of manual work in the job and the injuries? (higher % of manual work, higher risk?)
- Is there any relationship between accident categories and industry/occupation?
Investigation
Q1. Which are the industries with the highest number of workplace injuries? Is the industry with the highest injury, also the one with the highest major injuries?
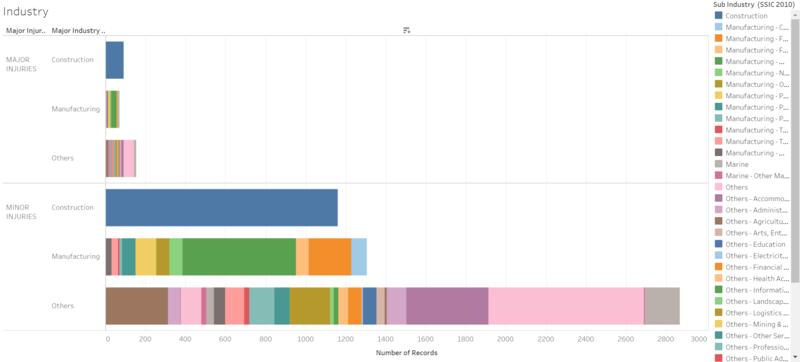
As the visualization for the above question was constructed, Industries was first separated by their major industries, which are Construction, Manufacturing and Others. However this was not a good representation of the industry as it was too generic. To achieve more indicative results, the chart was colored by the sub-industries within the major industry. This allows the user to identify more specifically the number of injuries in each sub-category.
The table shows that the manufacturing industry has the highest number of injuries (regardless of minor/major) but construction industry has a much higher number of major injuries. Further visualizations in later parts of this report will look further into it.
The usage of tableau also allows us to highlight areas of interest.
Q2. Which are the occupations with the highest number of workplace injuries?
As the visualization was being constructed, the need to clean and prepare the data arose. The raw data given contained multiple spelling errors and intepretation of similar occupation but with different naming terms (Example: Account Assistant and Assistant Accountant and Accountanting can all be just classified as Accountant).
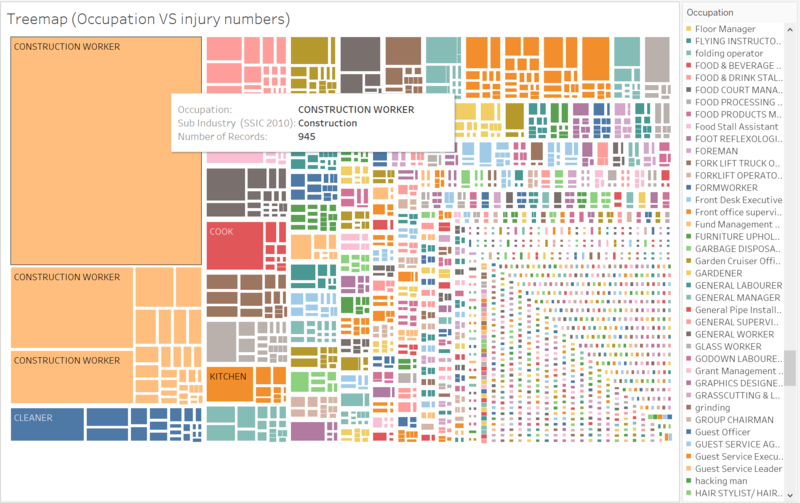
In order to gain a better visualization result, the data was cleaned and similar occupations where grouped together. To allow a more in depth understanding of how occupation actually has a relationship with the number of injuries, the industry is also reflected (Example: not all construction workers work in the construction industry).
From the resulting TreeMap generated below, it can be easily seen that the construction worker, cleaner and drivers are the top 3 occupations that suffer from workplace injuries. Although distributed among different industries, it is a cause for concern that these occupations are more hazardous than others.
Further visualization will be generated to build a connection between the injuries that occurs more commonly to these occupations and recommendations for safety precautions can be made.
Q3. Which body parts are most commonly injured?
and
Q4. Is there any relation between the body part injured and the industry? (Food&Beverage = more injuries to hands?)
As these 2 questions are relatively similar, they can be answered together with a visualization for clearer understanding.
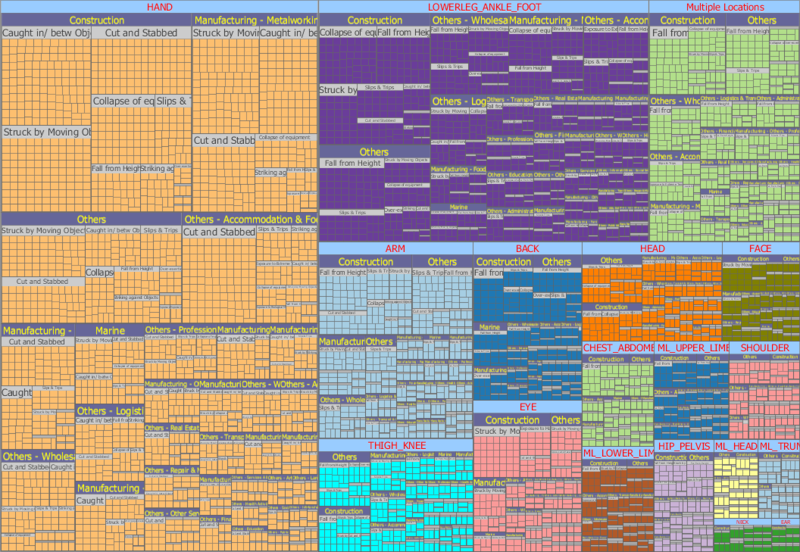
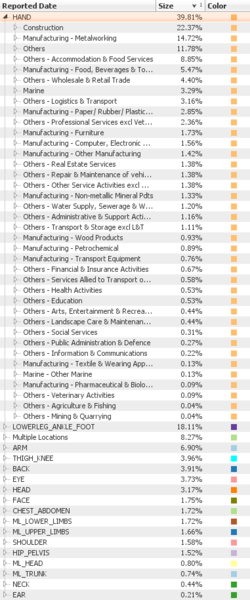
The TreeMap shown below indicates a huge 30+% of injuries to occur only hands. The cause of injury is also shown indicating a tendency for hands to be caught in between objects, cut or stabbed and struck by a moving object. Most of these incidents also occur in industries where most manual labor is being done, especially with their hands and not machinery. Construction and metalworks atrributed to almost 40% of all hand injuries. With reference to the earlier today showing Construction Workers in the sub-industry of Construction and metalworks as the occupation with the highest injuries, this visualizations have gave us rather defined evidence that construction workers in these 2 sub-industries are at a high risk of suffering from hand injuries.
With representations by the TreeMaps above and below, we are able to identify industries and their injury frequency to specific body parts. This allows WPS to conduct ground investigations on said industries and investigate if sufficient precautions are being taken to ensure workplace safety (Example: Are construction workers in metalwork industry equipped with proper hand protection equipment and knowledge of safety issues?)
Q5. Are the injuries self inflicted or through external causes?
and
Q6. Is there any relationship between working overtime and the injuries?
and
Q7. Is there any relationship between amount of manual work in the job and the injuries? (higher % of manual work, higher risk?)
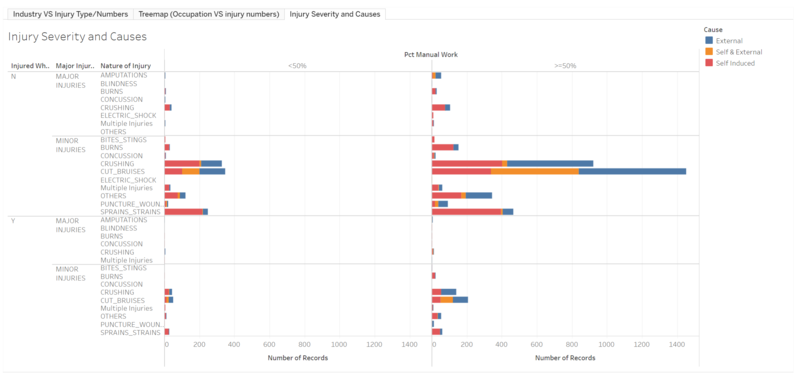
Through the visualization below, we can see that there are certain types of injuries that usually caused by self-inflicted causes. Cuts, bruises and amputation types of injury are usually involve external elements during the incident. Most of the injuries, regardless of severity, are due to self-inflicted factors.
There does not seem to be any relationship between working overtime and the number of injuries. However if manual work of the occupation exceeds 50% of the worktime, it significantly increases the risk of injuries.
From these deductions, number or types of injuries do not seem to be affected by whether the workers are doing overtime, but definitely with higher risks as manual work percentage increases. It can be said that occupations with high percentages of manual work needs to put in place much better safety precautions or training for their works. Majority of the injuries are caused through self, that being, either the workers are being careless or not enough effort is being done to protect them from their working tasks.
Q8. Is there any relationship between accident categories and industry/occupation?
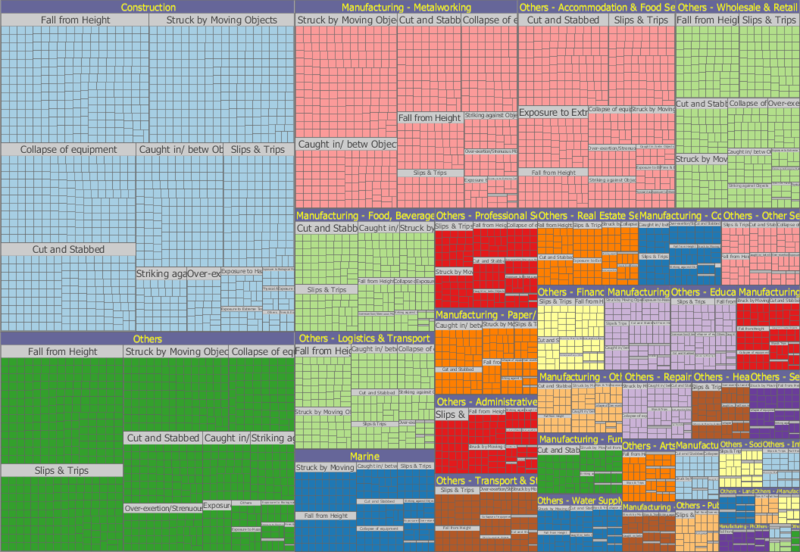
There is some relationship between the types of accident that happens to the workers and the industry that they are working in. In the visualization below, falling from height seems to be the top cause of injuries in quite a few industries but not so in some. Industries like construction, logistics and movement related are at higher risk of injuries due to falls. In contrast, industries like metalworks, food preparation and food services are prone to cutting and bruising injuries.
According to industry types, employers can train supervisors to look out for dangers that usually are the cause for injuries in their industries. Industries like construction where workers are working on platforms etc. can be monitored and warned by their supervisors if they do take risky actions during work. WPS can require all supervisors in particular industries to attend work safety courses relevant to their occupations, to ensure that they know of the measures to take to lower their workers risk to injuries. This visualization can help identify which injury is fairly common in the industry and further investigations can be conducted to identify the root of the cause.
Conclusion/Results
After going through the steps of pre-processing the data and generating the visualizations above. It was important to note that most raw data are not always immediately ready for usage by visualization tools. Outliers and errors are common in raw data and much effort is always needed to pre-process and rectify them.
In relation to the topic the theme of workplace safety. Visualizations are able to give viewers a quick understanding of the general situation of the workplace safety in Singapore. Although more precise information requires them to look deeper into the TreeMaps or use the interactive diagrams, it lets viewers easily identify the main causes of injuries in relations to factors such as industry/occupation/% of manual work/injured body parts. With a first impression in mind, recommendations can be more easily made and further investigations can be conducted with a goal in mind (Example: investigate why metalworks, even with protective gloves, are still having such high hand injury numbers).
This visualizations will greatly aid authorities such as WPS should they want to identify areas for the basis of investigation in their efforts to improve workplace safety in Singapore.
Tools Utilized
- Google Search Engine
- Tableau 10.0
- Tableau Public for interactive diagrams
- MacroFocus TreeMap and TreeTable
- Filters and Excel functions that aids data cleaning
