IS428 2016-17 Term1 Assign2 Jonathan Eduard Chua Lim
Contents
Problem and Motivation
In recent times, there had been growing interest in Workplace Safety since the legislation for Workplace Safety and Health Act take into effect in September 2011[1]. This is to protect the workers mainly from any hazards that they may encounter during their work. This is also for other stakeholders to understand the importance of Workplace Safety and to inculcate Workplace Safety in their respective companies.
Having personally worked in a manufacturing firm during my recent internship, I have seen first-hand the importance of safety in the workplace, and the active promotion of safety in the company’s values. Good safety practices are talked about with the rest of the employees and shared to other factories around the Asia Pacific Region and beyond.
Theme
The theme of this project is Championing Workplace Safety: Prevention is better than cure. The approach that I will have is to identify which particular industries have higher workplace lapses and to understand certain patterns unknown to stakeholders, so that they may be able to make better decisions for the improvement of workplace safety.
Stakeholders can be the business owners, government officials, non-government organisations and especially employees who could be working in industries where they need to watch for their own personal safety.
Questions
The following are the questions I have crafted for this task:
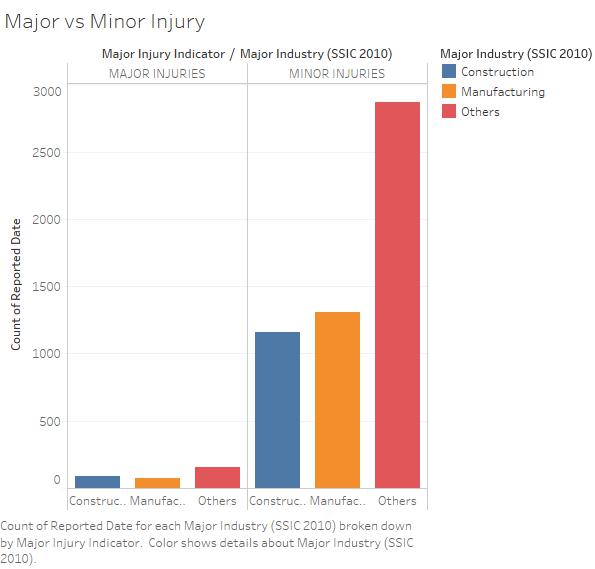
1.Which industry has the most major and minor injuries?
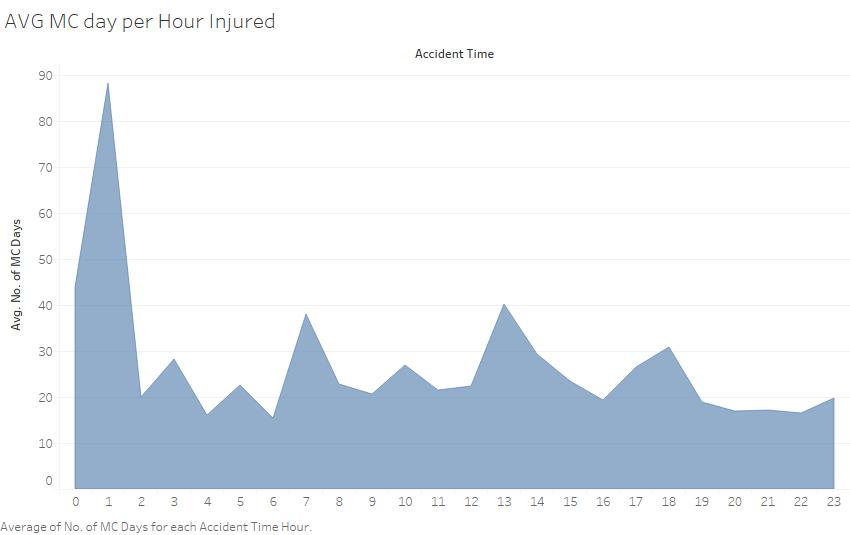
2.In a 24-hour period, which time period has the highest average medical leave (in days)?
3.Which industry has the average longest medical leave?
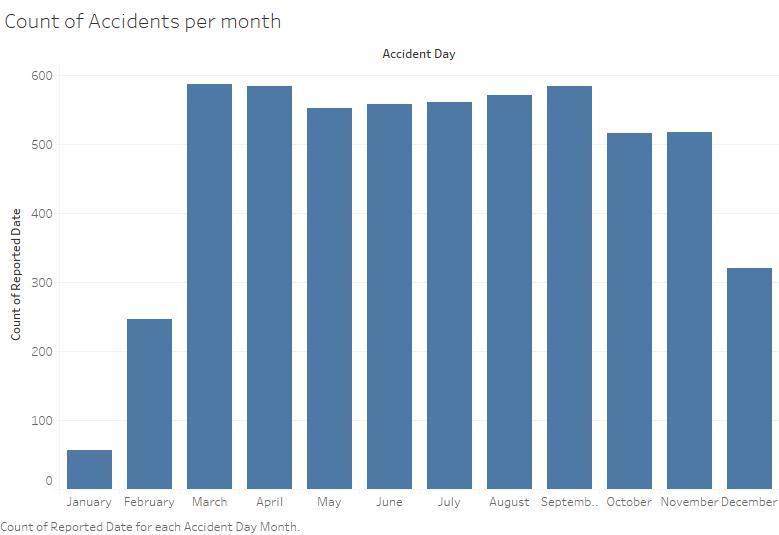
4.Which month had the highest number of accidents?
5.What is the distribution of the age of the injured employees?
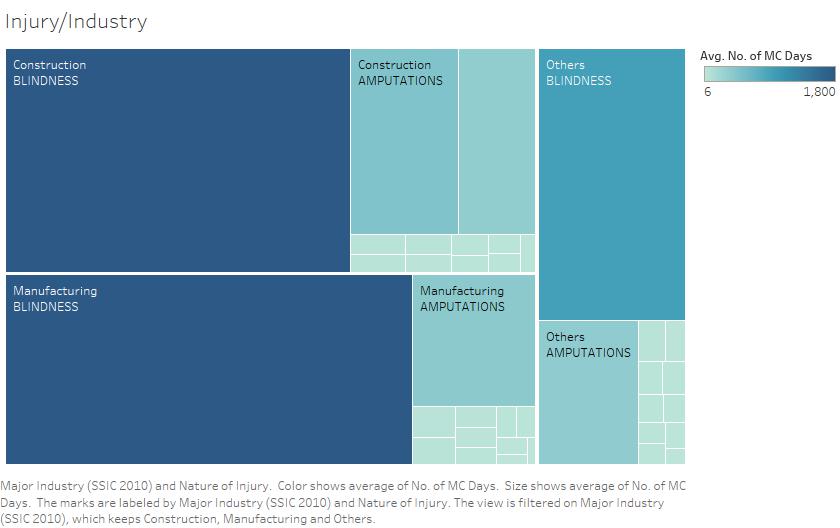
6.What are the common injuries per industry?
Data Cleaning
Step 1: Deleting of unnecessary columns
I have deleted the following columns and will be giving the reason(s) respectively:
| Columns Deleted | Reason(s) for doing so |
|---|---|
| Major Industry (SSIC 2010), 3 digit SSIC (2010), 2 digit SSIC (2010) and Org SSIC 2010 | It is irrelevant with respect to the questions |
| Informant’s Name, Informant’s Company Name, Informant's Company Postal Code (District), Informant's No Of Employees, Informant Type | The Geocoded information and the Informant Information is not relevant to answer the questions. |
| Accident Year, Occupier’s Name, Accident Type Level 2 Desc, Accident Type level 2 Category, Cause, Accident Type Level 2, Accident Agency Level 1 Desc, Accident Agency Level 1 Accident , Agency Level 2 Desc, Accident Agency Level 2, Employer's Name, Employer's SSIC, Victim's Employment Start Mth, Hospital / Clinic Treated or Examined | These information are omitted because of its lack of relevance. |
Step 2: Data Formatting I have done the following changes in Microsoft Excel
- Reformatted “Reported Date” to dd-mmm-yyyy
- Reformatted “Victim’s Employment Start Date” to “dd-mmm-yy”
- Reformatted “Accident Date” to “dd-mmm-yy”
Step 3: Load the data onto Tableau
- Convert “Accident Day” to Date Data Type
- I used the “IF” and “ELSEIF” function to change the string value of “Injured While Performing Official Work Duties” from “T” and “F” to “True” and “False
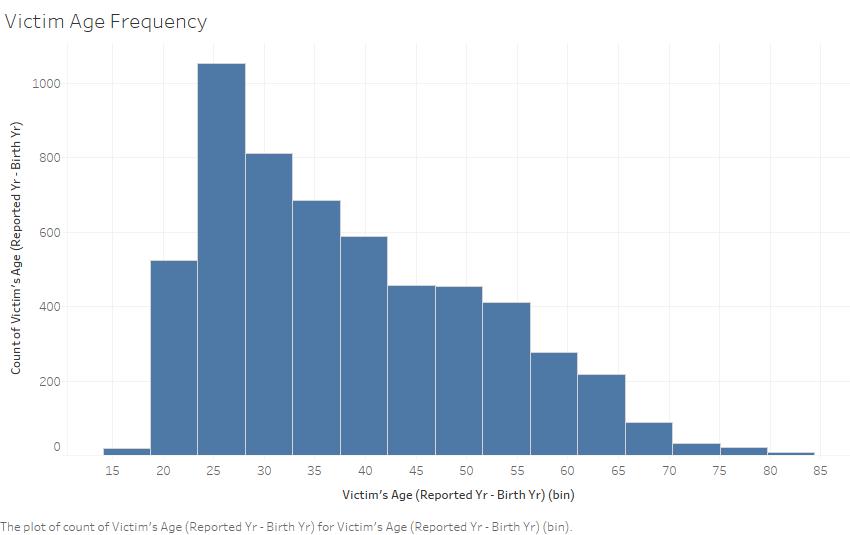
- I converted the column “Victim's Age (Reported Yr - Birth Yr)” to be a Bin, to be used for a histogram of the Victim’s age as of 2014 and the respective frequency.
Visualisations
I have used Treemaps, Bar Charts and Histogram to visualize different aspects of the dataset.
I have used the “Reported Date” column in COUNT to act as variable for every occurrence of an accident. This is because an accident will only be in the dataset if it has been recorded by an individual sending information to the WSH.
For the treemap below, I have put the injury as the first hierarchy, followed by the industry. I was interested to see the type of injuries occurring, and afterwards which industries did these occur. The size is the number of Medical leave (days) given to a specific type of injury, and the different boxes has the different types of injuries present.
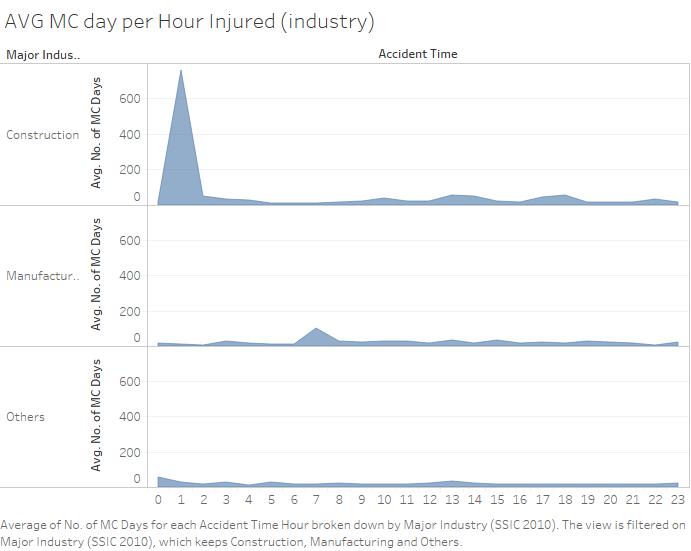
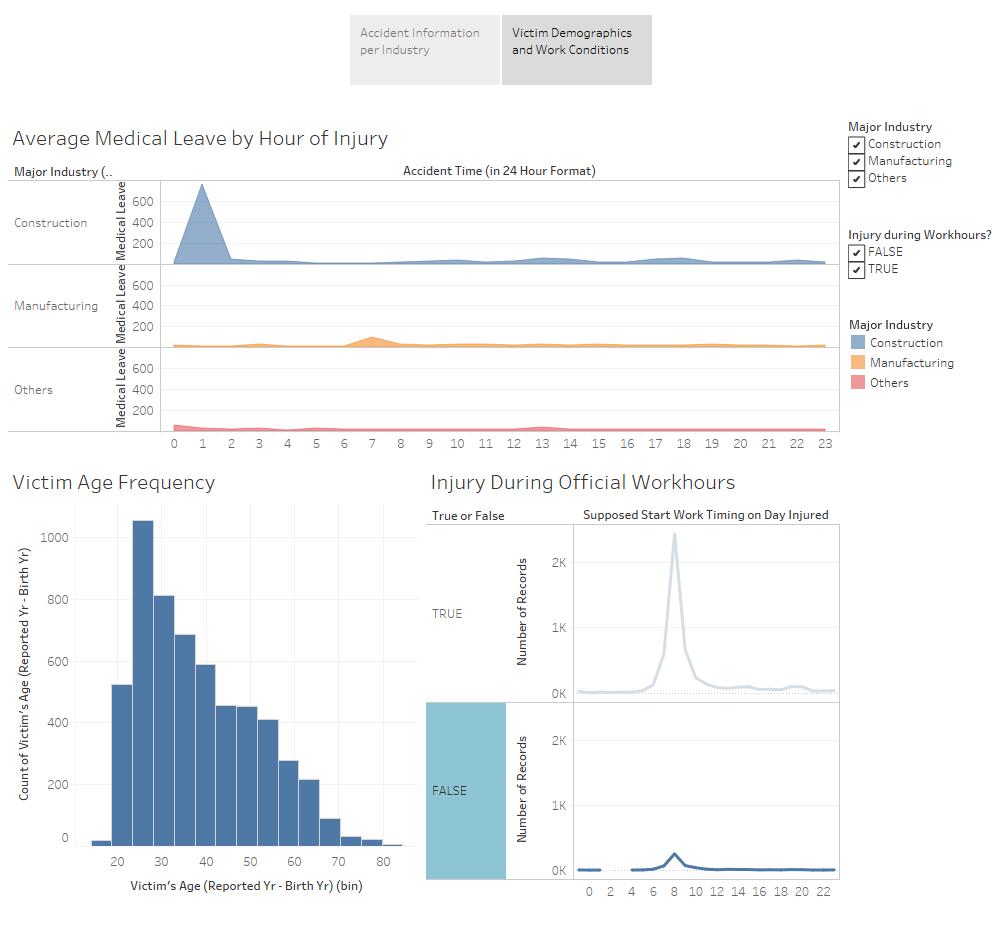
I have also used the average number of medical leave given to find out the time in which most accidents occur, in a 24-hour timeframe. This is to aid me in finding out which working hour are the employees more likely to get injured.
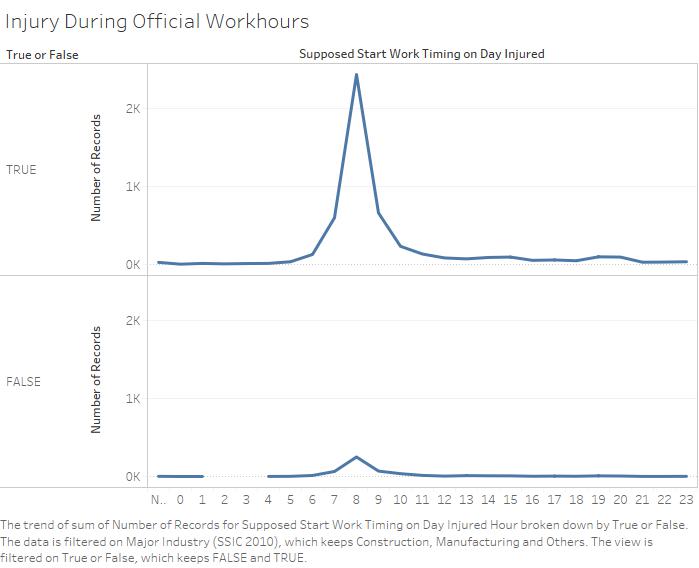
Lastly, I have produced another visualization in which it showed the employee was doing official work at the time of the accident, in a 24-hour timeframe. I would like to see if they were doing what has been agreed on by both the employee and the employer, at the time of the accident.
Observations from Visualisations
1. Which industry has the most major and minor injuries?
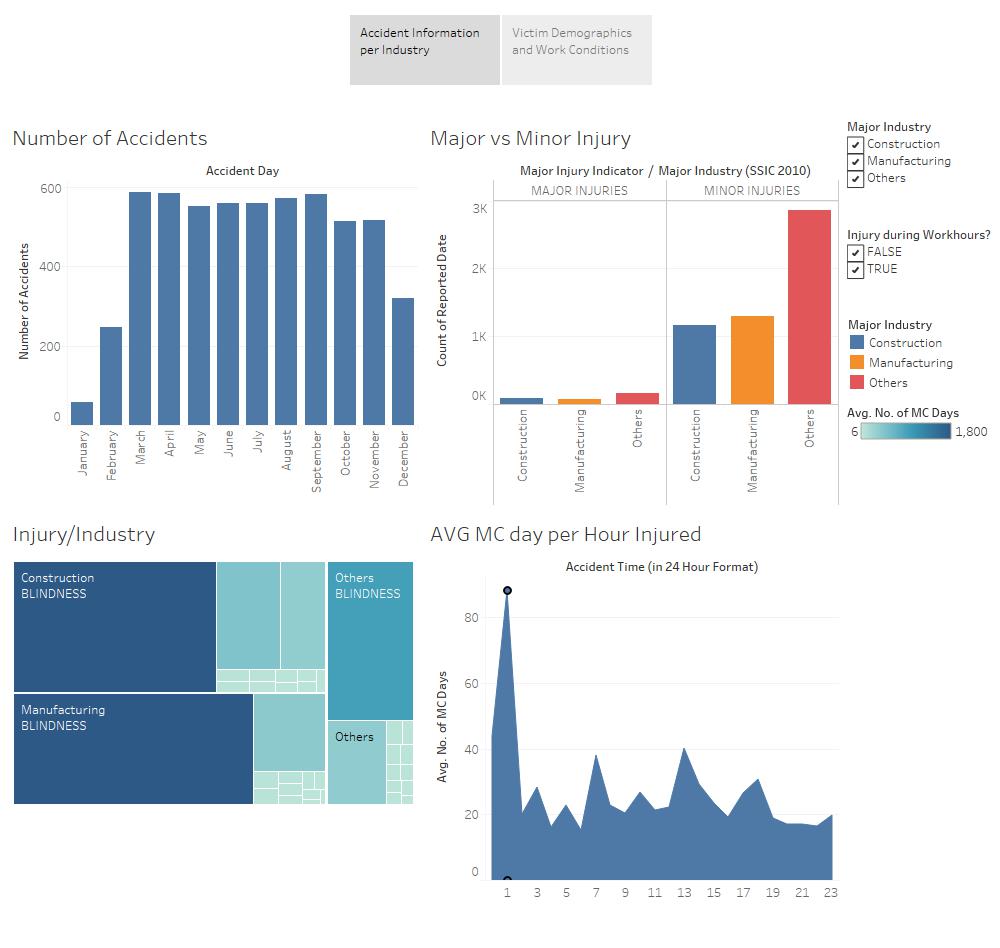
The “Others” category seem to have the most major and minor injuries. The Manufacturing industry has the 2nd most minor industries, followed by the Construction Industry. For the Major injuries, the construction industry seems to have slightly more injuries than the Manufacturing industry.
2. In a 24-hour period, which time period has the highest average medical leave (in days)?
Accidents occurring at 1am (or 01:00) seem to have the highest average of Medical leave issued in any given 24-hour period. Next in line is 7am (07:00) and 1pm (13:00).
3. Which industry has the average longest medical leave?
Accidents occurring in the industry has the average longest medical leave given for any incident. This could explain the sudden spike in the highest average days of medical leave issued during accidents at 1am. At the Manufacturing sector, there is an increase in the average days of medical leave for accidents occurring at 7am.
4. Which month had the highest number of accidents?
March has the highest number of accidents in 2014, while April and September closely follow behind. January seem to have a significant dip in reported accidents, followed by February.
5. What is the distribution of the age of the injured employees?
There is a higher distribution of injured employees that are in their early 20s to their early 30s.
6. What are the common injuries per industry?
For the Construction, Manufacturing and Other industries, Blindness has the highest number of injury. An interesting observation is that Manufacturing and Construction has a highest occurrence of Blindness as an injury, although Blindness from the Manufacturing industry has a wider rectangle than same injury for the Construction industry.
Deliverables
I have created the summary of the deliverables using the Story Function in Tableau.
The link to my Tableau public site: [2]
Conclusion
In conclusion, these set of visualisation is very useful for the relevant stakeholders, who either want to keep working places safe for their employees, or those who may be working in these industries and want to keep themselves in a safe working environment. I hope that the stakeholders will be able to see these visualisations and make better decisions towards safer workplaces.
Tools Used
I used the following tools to achieve these visualisation
1. Microsoft Excel
2. Camtasia Recorder
3. Tableau Desktop
4. Tableau Public
References
W. S. Council|工作场所安全与卫生理事会, (2015, March 14). Retrieved September 25, 2016