IS428 2016-17 Term1 Assign2 Bong Jun Hao
Contents
Theme of interest
As of May 2016, the number of workplace deaths has hit 32, 6 more than in the same period last year. This prevalence of workplace-related fatalities has prompted the authorities to raise penalties for offenders or employees with safety lapses, but the question lies in whether stricter or heavier penalties alone can curb this trend.
Furthermore, to what extent would this actually solve the issue? Currently the heavier penalties introduced includes longer stop work time, from 2 weeks increased to 3 weeks, as well as depriving companies of new foreign workers until they have sorted out their safety issues. All these measures only serve to "worsen the dire situation for meeting deadlines and financial penalties for errant companies", according to the Singapore Contractors Association.
Hence, this workplace safety issues has sparked my curiosity in understanding the reason behind these injuries, as well as to find out if there is any underlying relationships between the injuries such that it can be resolved and worked on to effectively reduce the number of such incidents in Singapore, rather than to use financial deterrents which seem to only add on the issues and pressure companies even more.
Questions for investigation
1. When do injuries occur the most throughout the year?
2. Is there any particular time of the day where injuries occur more often?
3. Which age group is more prone to injuries at work?
4. Is there a correlation between experience and injury occurrence?
5. Which gender is more prone to injuries?
6. Which body part(s) is most commonly injured?
7. For each body part, is there a more common type of nature of injury?
8. Which industry has the highest rate of workplace injuries?
9. Which occupation has higher risk of injuries?
10. Is there a correlation between the cause of injury, the type of accident and the severity of the resulting injury?
11. Is there a relationship between the proportion of manual work, the type of accidents that occur as well as when a worker is doing overtime?
12. Any relationship between occupation, the majority of a injury, hospitalization and MC given?
Data Preparation
The excel file given to us has some irrelevant columns, which I have removed. The Occupier's Name, Org SSIC (2010), 3-digit SSIC (2010) and 2-digit SSIC (2010) has been removed as they are not relevant or useful to the analysis required for this assignment.
Other forms of manipulation includes using calculated field to pull out the String format of the time that the accidents occurred, and then use the split function to pull out only the hour of the occurrence of the incident as a calculated field so that it can be used to plot out how injuries tend to happen over a day.
Bins were also set up with regards to the age as well as months that the workers work to help form a distribution and to highlight trends.
Timing of injuries
Distribution of injuries throughout the year
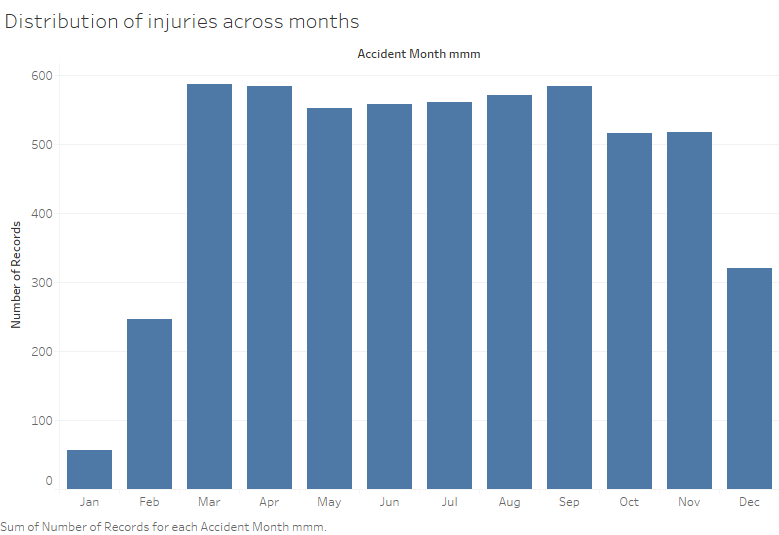
In 2014, the injuries seem to occur least at the start and the end of the year. January had the lowest number of injuries at 57, followed by February with 246 and then December with 320 injuries.
The distribution of injuries between March to November is relatively fair with slight dips observed from October onwards.
Distribution of injuries by day of week and timing
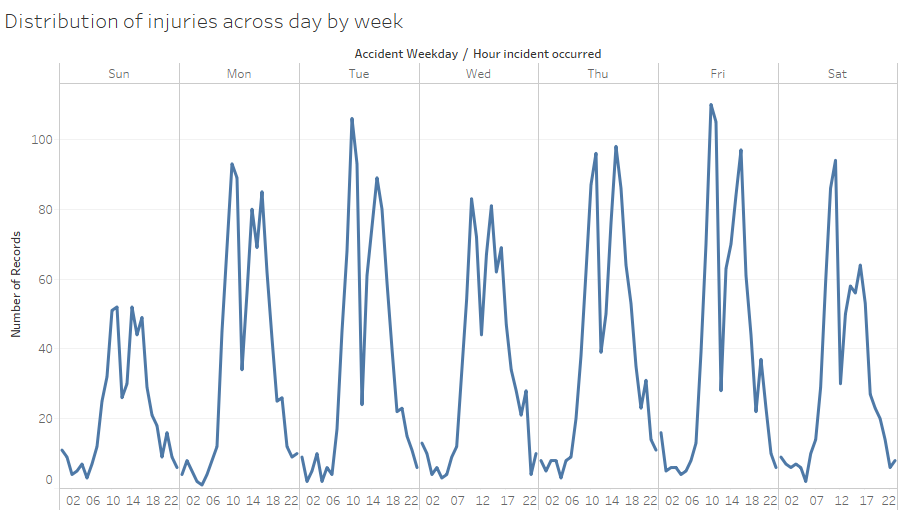
To better find out and understand if there is a pattern in the injuries that occur across the day, I used a formula to extract out the hours where the injury occurred from the Accident Time column using the formula, "SPLIT(RIGHT(STR([Accident Time]),9),":",1)". This allows me to extract out only the hours where the incident occurred and also to plot a graph using three variables, the day of the week the injury occurred, the hour it occurred as well as how many times it occurred.
From this it can be observed that in general, Sundays tend to have the least number of injuries occurring. An interesting observation is that the peaks of injuries incident seems to occur between 10am-11am on all days, inclusive of Sundays.The second peak where injuries occur seems to be at between 2-4pm.
Profile of injured workers
Age Profile
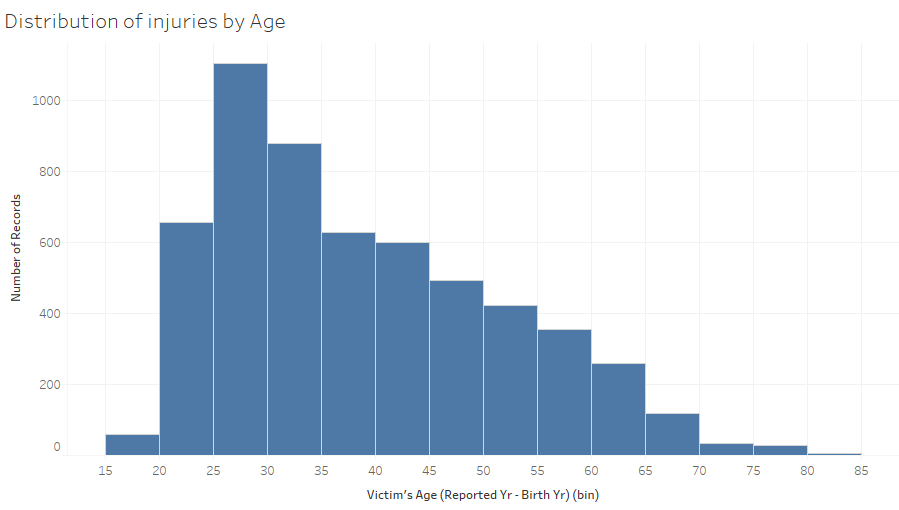
By creating a bin based on the workers' age, setting the bin size to 5 and then converting to continuous, a histogram is obtained to give us a distribution of the age of the injured workers. It can be seen that generally injured workers tend to fall within the age range of 25-30 followed by 30-35 years old.
Experience of workers
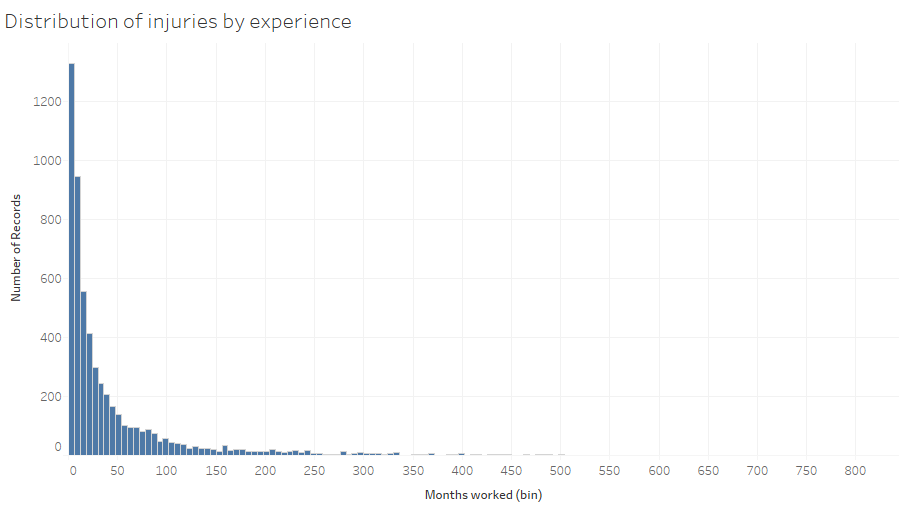
Experience seems to play a huge factor in determining the proneness of a worker to injury. It seems that majority of injured workers seems to have less than 1 year of working experience. This is especially prominent in the first six months where the number of workers injured with less than 6 months of experience is almost 2.5 times that of workers with at least 1 year of experience. As the workers gain experience as they work, the likelihood of them getting injured seems to fall off.
Injuries by body parts
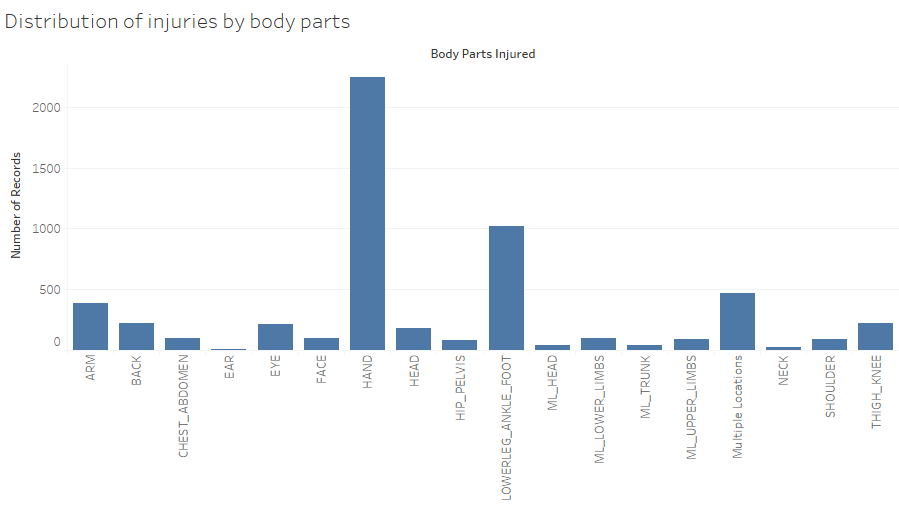
It seems that the hands are the most susceptible followed by foot injuries. This then leads to the next question as to the nature of injuries that is always linked with these parts, i.e what is the most commonly occurring nature of injuries for the hand?
Injuries by body parts and nature of injury
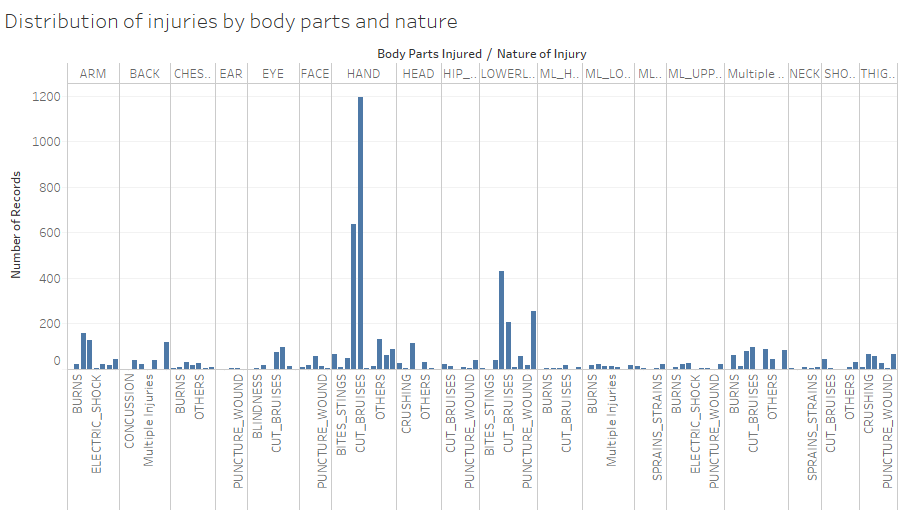
It can be seen that the most common type and nature of injury would be cuts and bruises followed by crush injuries for the hand. As for the next most common body part injured, the foot, it is most susceptible to crush and then cuts. This gives us an indication of which area of focus we should look at to reduce workplace injuries. For example, gloves and proper boots should be enforced to reduce the damage and injury caused to these two prominent body parts.
Industry Analysis
Industry with highest number of injuries
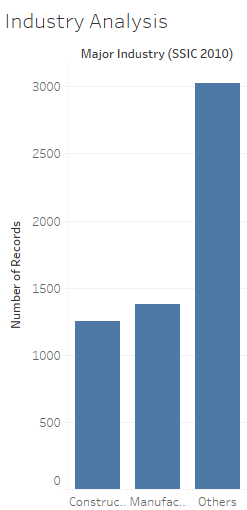
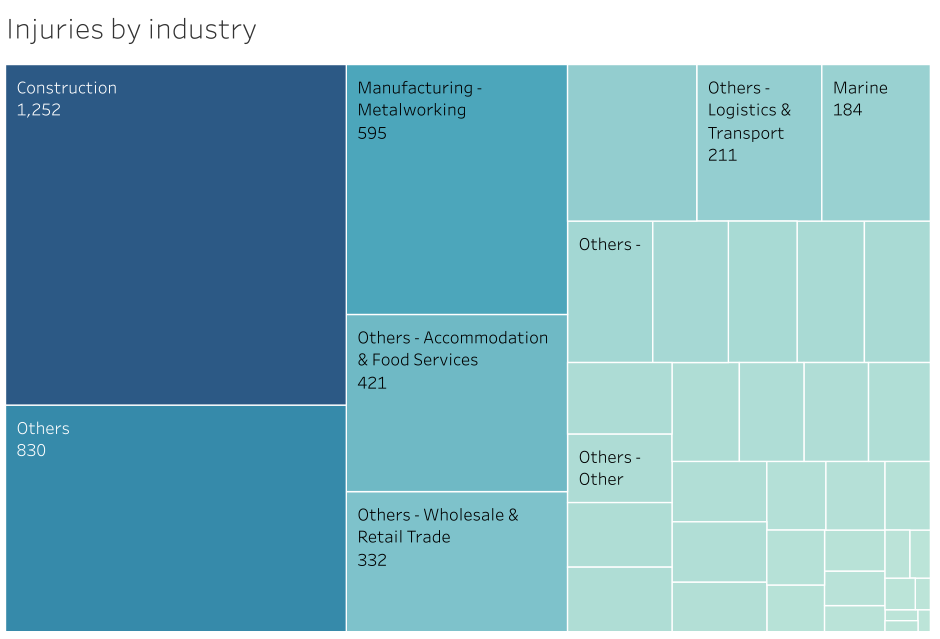
It is observed that there are 3 industries in which injuries occur, namely Construction, Manufacturing and the rest categorized as Others. Using a tree map to aid in the visualization shows that Construction related injuries takes up the highest proportion, followed by that in the Others category. For the others category, it can be taken note that jobs in the accommodation and food and services sector as well as that in the wholesale and retail trade sector has higher occurrences of injuries. On the other hand, work related to metal works in the Manufacturing industry is also quite prominent when it comes to injuries.
Occupation most susceptible to injury
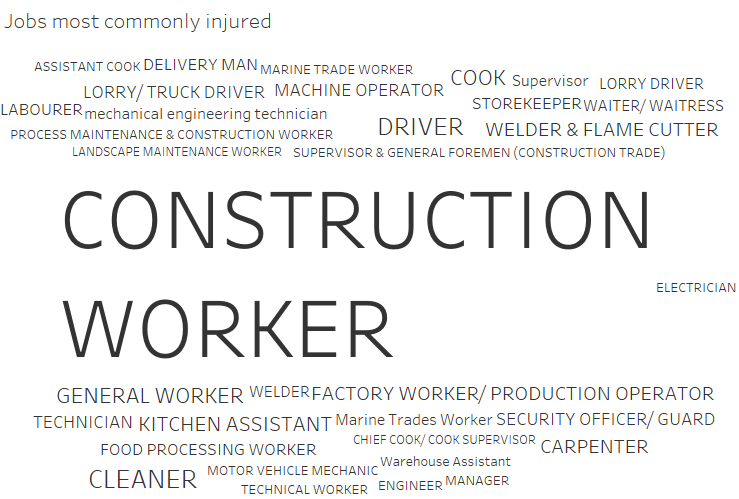
Due to the many different kinds of occupation encountering injuries at the workplace, a word cloud is used to quickly visualize the top occupations most susceptible to injuries. The occupations are filtered with a minimum occurrence of 20 so as to give a better and clearer picture. It can be seen that the construction workers are the most prone to injuries, followed by the cleaners and then cooks.
Injuries Correlation
Relationship between cause of incident, accident type and severity of resulting injury
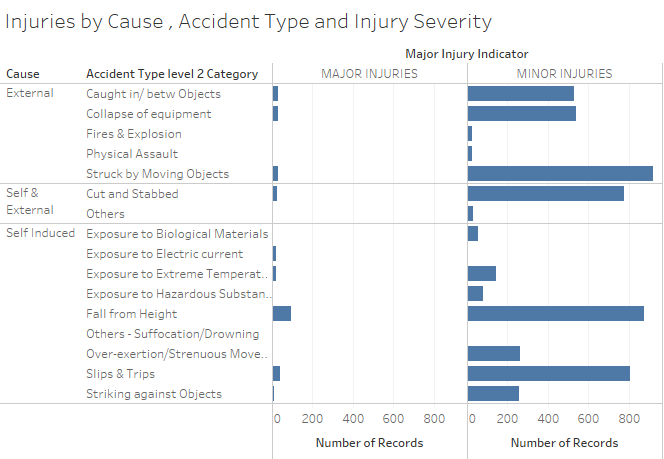
It can be observed that major injuries tend to be self-induced, with falling from height and slipping/tripping as one of the most common categories. On the other hand for minor injuries, it can be due to external, internal or both external and internal causes. It can be noted that externally caused injuries tend to be due to being struck by moving objects, whereas self induced minor injuries tend to be under the falling from height as well as tripping and slipping category.
Relationship between the proportion of manual work, the type of accidents that occur as well as when a worker is doing overtime
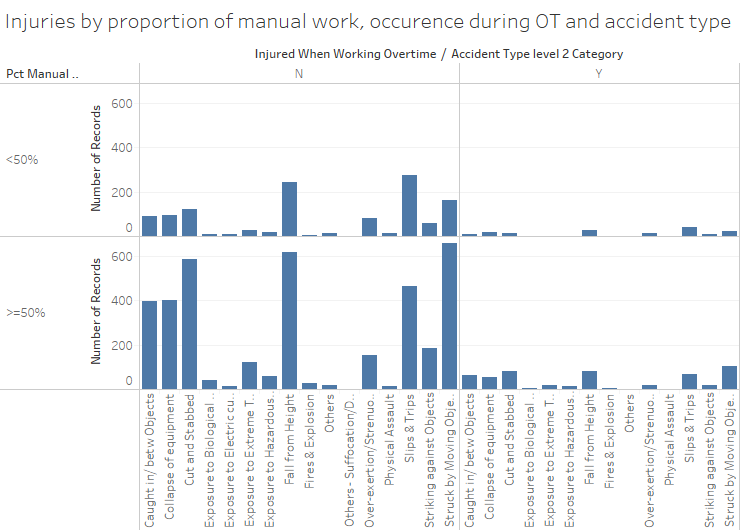
When the nature of a job is less than 50% manual work, the category of accidents that occur tend to be slipping and tripping as well as falling from height. However when the job is more than 50% manual work, the accidents that occur tend to be being struck by moving objects, falling from height as well as being cut or stabbed. This can give rise to insights to companies seeking to reduce such accidents as it helps to indicate which category of accidents to look out for.
Visualization
URL to interactive dashboard: https://public.tableau.com/profile/publish/Assignment2_251/Story1#!/publish-confirm
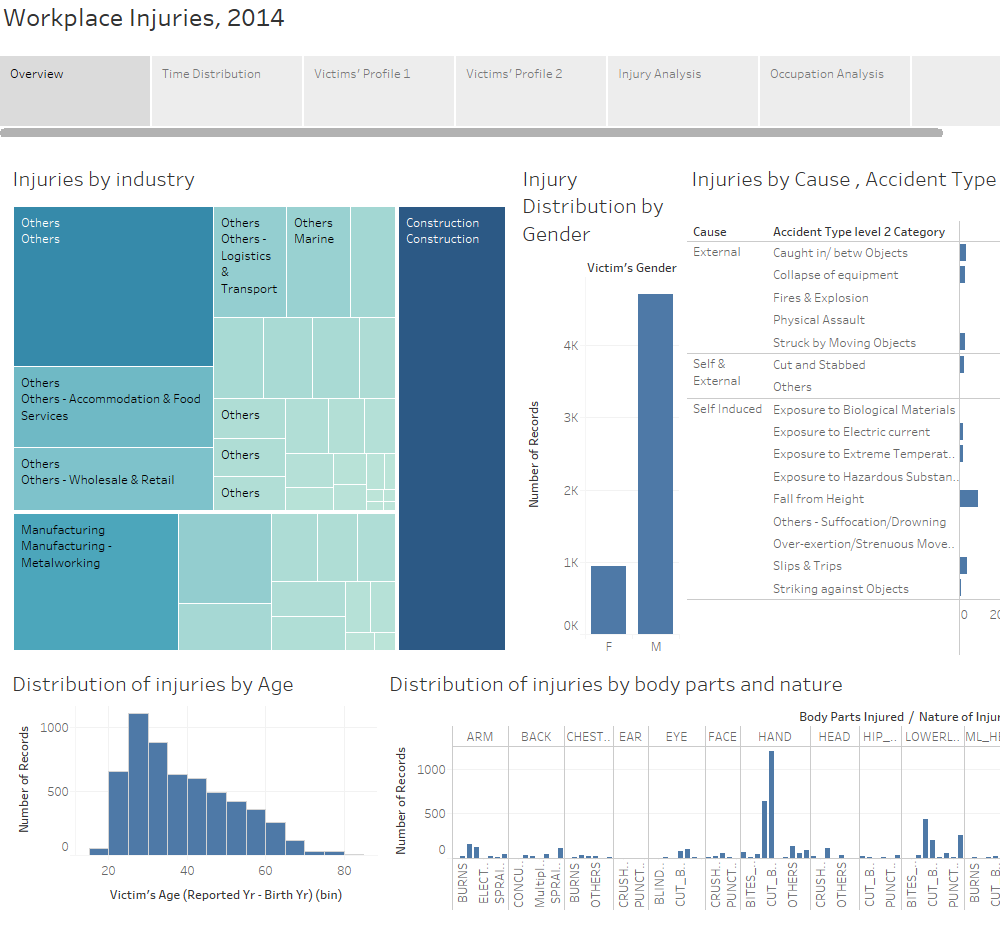
The final visualization consists of a story that is made up of 6 dashboards. The first dashboards gives an overview which allows the user to click on the different breakdown of injuries occurrence by industry. By clicking on the various sub-industries, the gender , the age, the category as well as the distribution of the injuries by body parts and nature is filtered to give the user an overview of any patterns occurring for each industry.
The other 5 dashboards gives a different analysis, ranging from time distribution of the injuries, the profiling of the victims in two forms, the injury analysis and occurrence of the injury breakdown as well as the occupational patterns.
The time distribution allows the user to identify based on month as well as particular timings of the day the occurrence of injuries so as to determine which particular time period requires specific attention to reduce the occurrence of injuries.
The profiling of victims breaks down the age of victims into their respective gender, as well as experience level. Victims' Profile 2 allows for a more interactive way of looking at the distribution based on age and months worked.
Injury analysis gives a picture of where injuries occur most often in terms of body parts, as well as the nature of injuries that follow these parts.
Finally,the occupational analysis enables the user to click on jobs with higher occurrence of injuries to see the average MC given based on the occupation and severity of injury.
Other findings
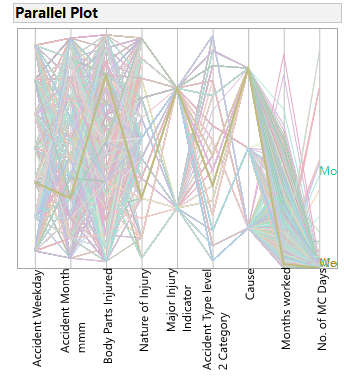
The use of a parallel plot helps me to identify certain extremities easily, for example, one particular worker has 3600 days of Medical Leave after working for 3 months and getting injured from an exposure to electric current. Other anomalies identified includes how a worker had major injuries and had to go through amputation despite being relatively much more experienced than most at 802 months.
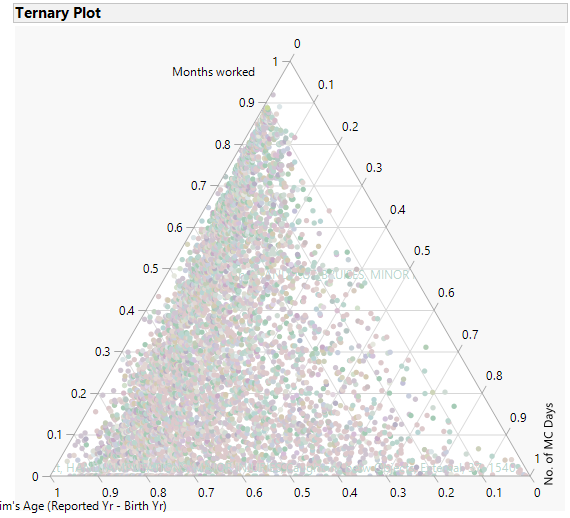
When using the age, experience and MC to plot a ternary plot, it seems to suggest that the older a worker and the more experience he has, the lesser the amount of MCs taken resulting from an injury. This seems to suggest that perhaps age and experience do help in mitigating injuries at work.
