IS428 2016-17 Term1 Assign1 Lim Lai Ho
Abstract
Commercial price index has been increasing over the past few days. Should there be policy to mitigate this issue?
Problem and Motivation
Singapore is a small country has a total land area of 719.1 square kilometers. Every piece of land is valuable to us and we should fully utilised it. The usage of land has been divided into three main sectors (Residential, Commercial and Industrial). However, the price of land has been increasing over the decade. High rental fees has busted many companies in the commercial sector. In this assignment, I will focus on the commercial sector. My aim is to study the relationship between the price of commercial property and its supply. With the result, I should be able to determine what kind of policy should be implemented to prevent the price from rising further.
Approach
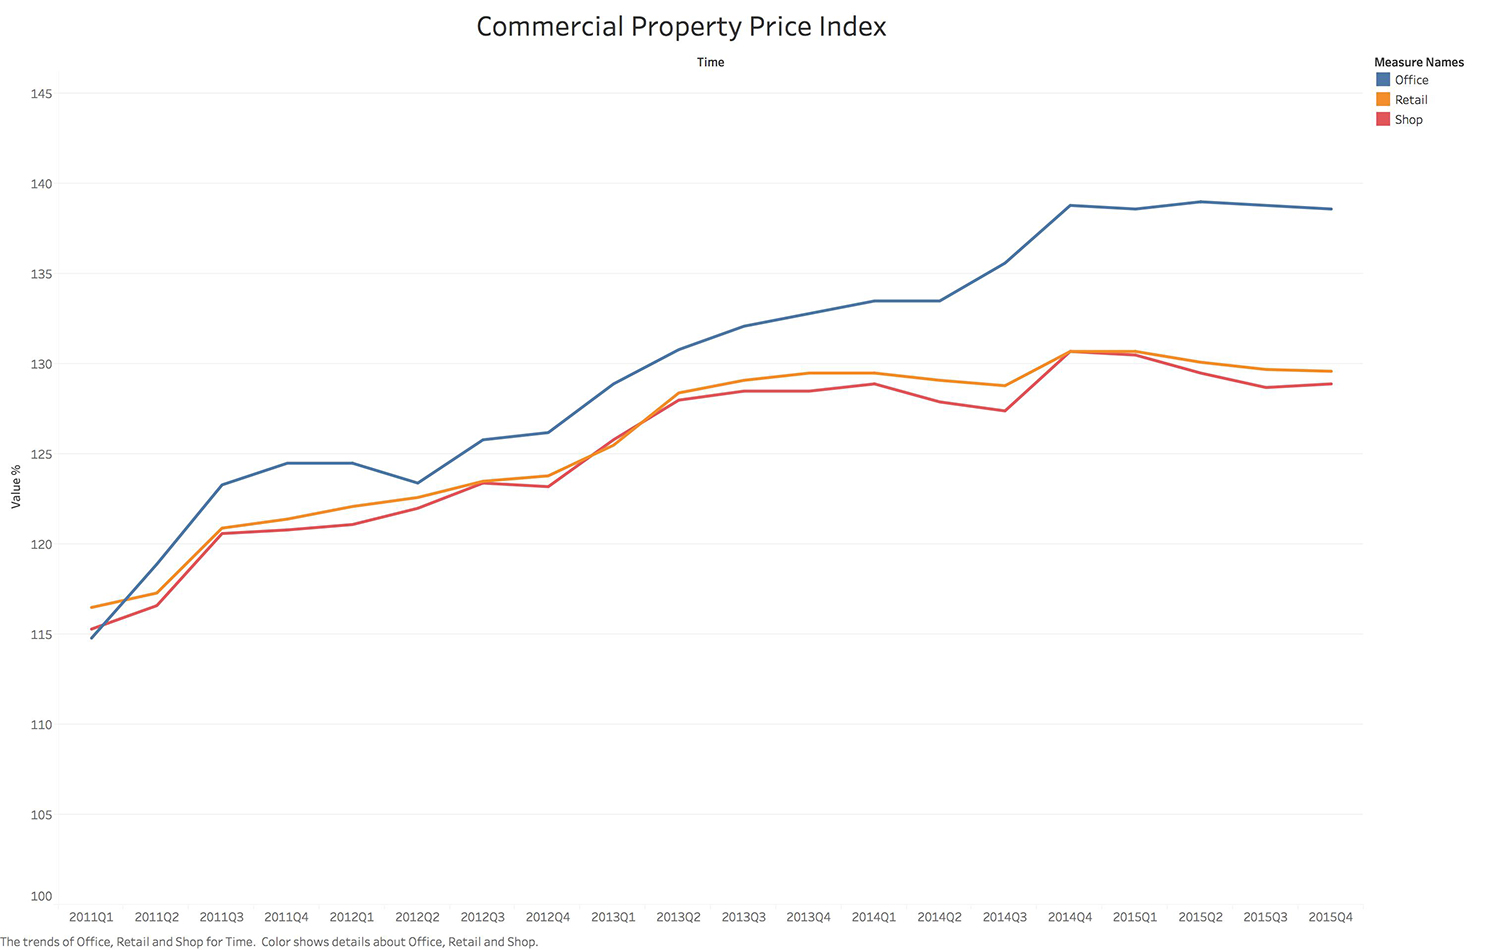
My first approach was to find whether has the price of commercial property increased and how much has it grew over the past few years. The dataset that I have used contains the price index of three different areas within the commercial sector. The main areas used are for office uses, retails and shops. This allowed me to generate a line graph to display the changes in each area from the start of 2011 to the end of 2015. The starting value of y-axis of the graph was set to 100 instead of 0 was to ensure that reader could see the small changes in gradient of the lines more significantly.
Based on the graph above, I have identified four changes in the price index of commercial property.
- The price index of office property has increased from the lowest to the highest among the three.
- The price index of all areas have increased within the range of 15% to 35%.
- The price index of office property has increased at a faster rate compared to the price index of retail and shop property.
- The price index of all areas did not change drastically in 2015.
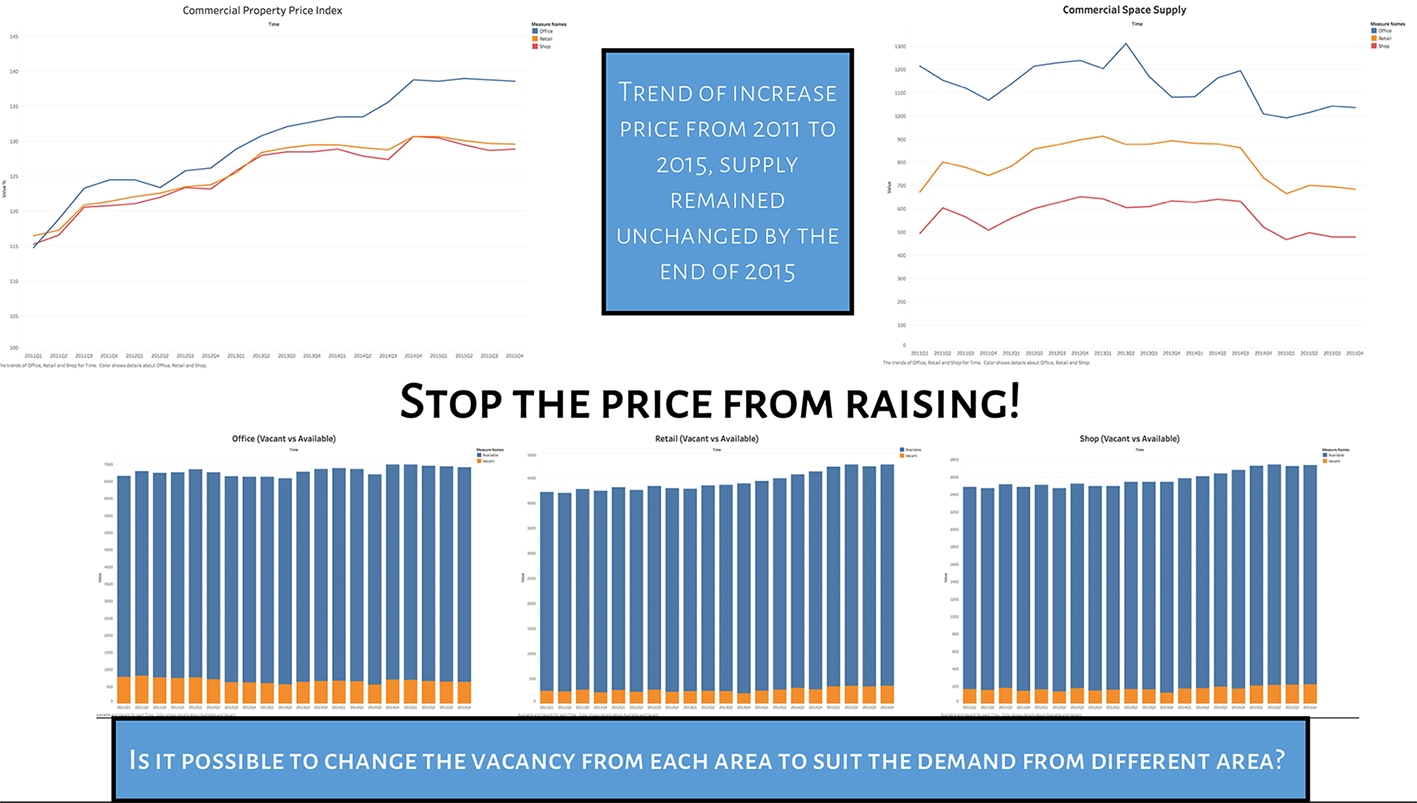
In order to further explore the reasons behind the increased in price index across all areas within the commercial property, I have plotted another line graph to help us to understand the amount of supply in different areas of the commercial sector from 2011 to 2015. A line graph could clearly display the changes of values of the supply over the course of five years.
From the graph, I could observe that
- The office property has the highest supply, followed by the retail property and then the shop property.
- The supply of office property was lower in 2015 than in 2011.
- There was no increase in supply in all sectors based on the figures of the start of 2011 and the end of 2015.
There is a similarity in both of the graph. The office has the greatest supply and highest in price index, followed by the rental and then the shop. They have shown that the amount of supply can be relate to the price index. However, I have decided to plot three more bar graphs to show the vacant and available (occupied and unoccupied) spaces in each area. This would allow me to have better understanding of the supply.
The three bar graphs are displayed in a similar way with the x-axis as the time (by quarter) and the y-axis as the total value of the available space in the specific market. The blue shaded area is the available spaces while the orange shaded area is the vacancy at the point of time. From the three graphs above, we could clearly see that the vacancy at any point of time were about 10% of the available space in all the three areas.
Tool Utilised
The tools used for this assignment.
- Tableau – to convert dataset into graphical forms
- Microsoft Excel – for data cleansing, removing unnecessary data
Results
Although there is no form of evidence from the graph to show that there is no shortage of supply at any point of time, in fact there is at 10% of vacancy in each area in the market, the price for office uses grew faster than the rest. Also, there is no drastic change in price index in 2015. However, by comparing to 2011, the price index has significantly increased and yet the supply has not increased but remained about the same by the end of 2015. I believe that this has causes the rise in price. To mitigate such issues, I recommend that
- Policy to control the price, especially in the office area, to prevent it from rising further
- Policy to reduce the price, by increasing the supply based on the demand in each area
- Policy to increase or decrease the supply based on the demand in each area, allow conversion of different area (e.g. retail to office)


