IS428 2016-17 Term1 Assign1 Joachim Fu Jun Hao
Abstract
Housing in Singapore has been a common topic for everyone, locals and foreigners alike. However, with the increasing demand in properties, private residential property types have been introduced into the housing market to attract buyers who are willing to afford the different types of private properties. In this project, the focus will be to find out the supply and pricing trends and to understand if there are any possible relations between them. Thereafter, there will be policies proposed based on the perspectives of the land developers.
Problem and Motivation
Land scarcity has been one of the major issues Singapore is facing. Currently, there is a policy which aims to maximise land capacity and was implemented by the Ministry of Law: Residential Property Act. It states that Singaporeans are given priority when purchasing landed properties and foreigners are only considered depending on their social contributions to Singapore. However, I feel that this does not curb land utilisation effectively. As such, it is important to understand the land utilisation rates by analysing the trends in the supply of private property types and the willingness of the buyers to pay for the respective housing.
Approaches
The main data was extracted from the REALIS database and opened with Microsoft Excel as CSV file. The data is separated into its respective metadata by delimiting comma and saved as an excel file. Thereafter, I determined what columns were useful to help me identify the trends and removed those that were not necessary. Tableau was then used to open the huge excel data. Charts such as bar graphs and line graphs are used to represent my trend analysis.
Based on the trends that are identified, there is a possibility that supply of private properties may be related to prices and vice versa.
Tools Utilized
1. Piktochart - Inforgraphic design 2. Tableau - Visualising data 3. Microsoft Excel - Delimiting into respective metadata types
Infographic
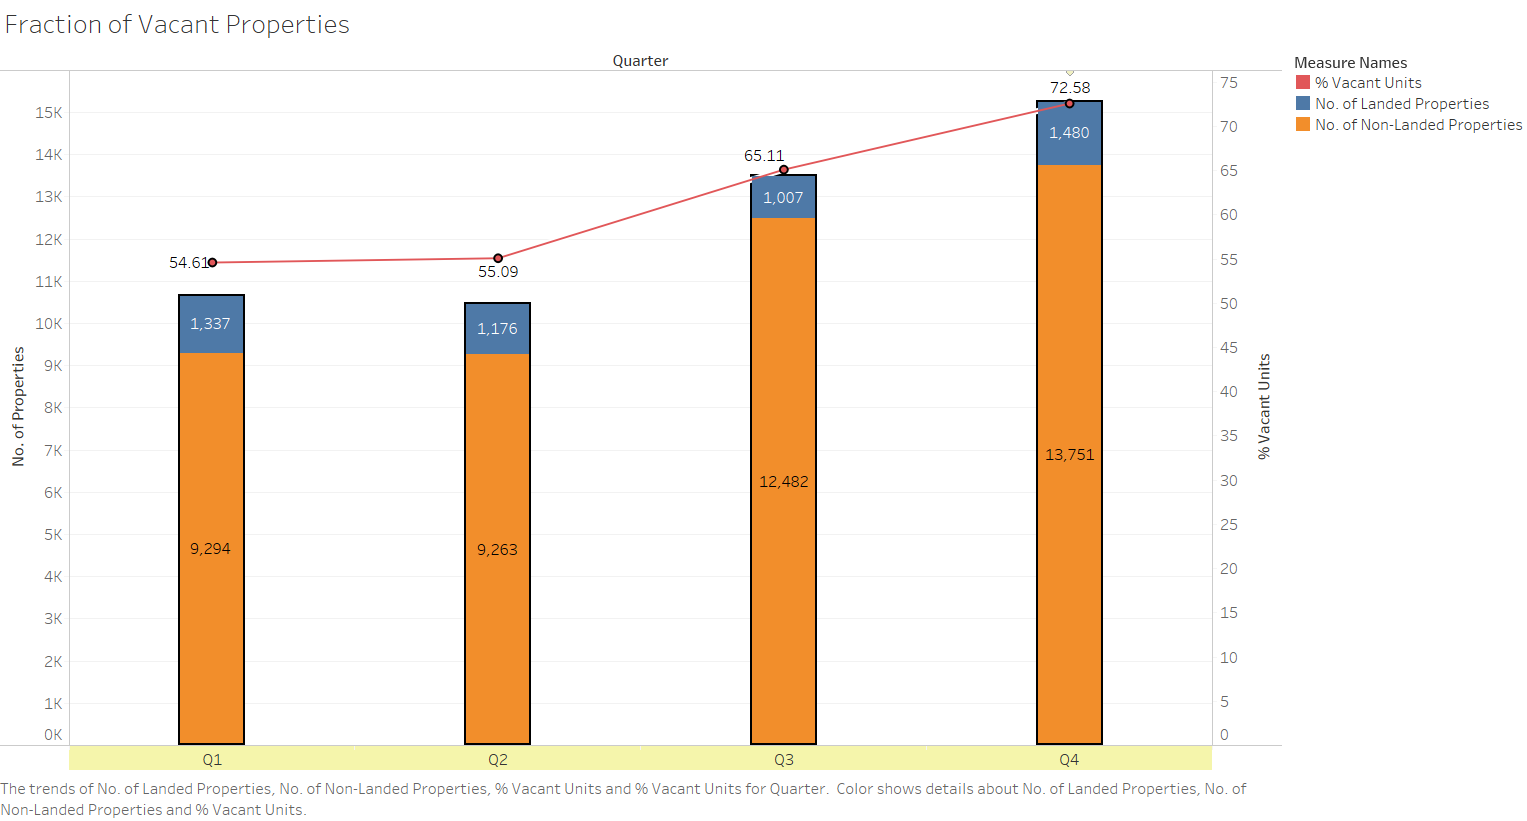
A thorough analysis was made to identify the types of categorical and continuous data. To understand trends, I chose quarters as one of my categorical data to be used to understand the supply and pricing trends over the four quarters in 2015. For the supply trends, I decided to use the number of properties supplied and a new calculated field called % Vacant Units.
This chart mainly shows the increasing number of non-landed private properties perhaps due to the increasing demand in such property types. However, the increase in vacancies shows that all the units are not fully taken before or after completion of the project.
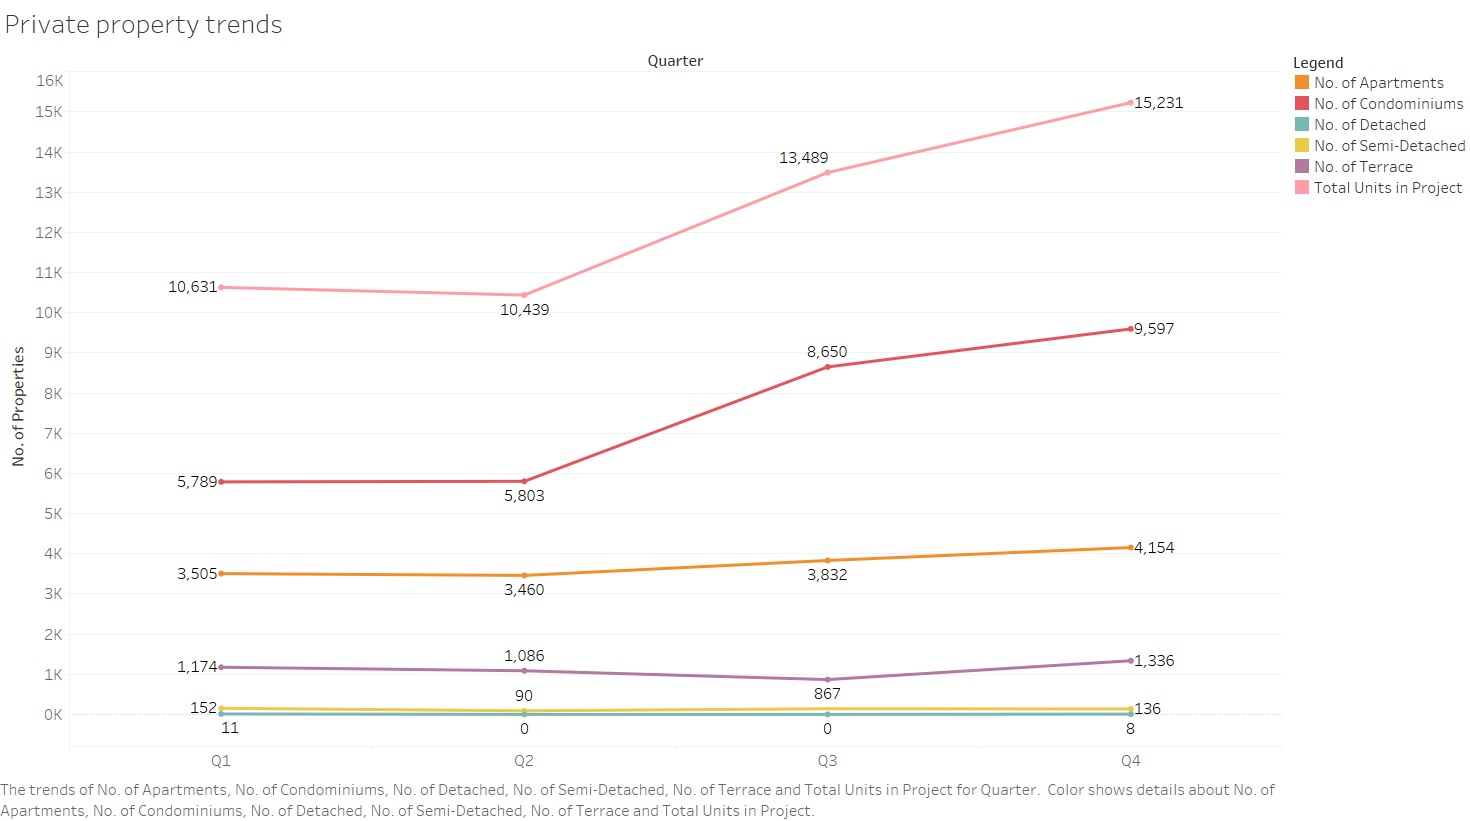
The private properties are divided into the respective types and this chart shows that the increase in the overall number of units is contributed mainly by the increase in condominium supply.

