IS428 2016-17 Term1 Assign1 Joanne Ong Shi Ying
Contents
Abstract
This project aims to discuss and analyze the supply and prices of condominium houses in Singapore.
Problem and Motivation
Singapore faces land scarcity, hence we should maximize the utilization of land and weigh the opportunity cost of all options. It is important to analyze if we are currently oversupplying private properties, leading to lack of land space, which may affect our country’s growth.
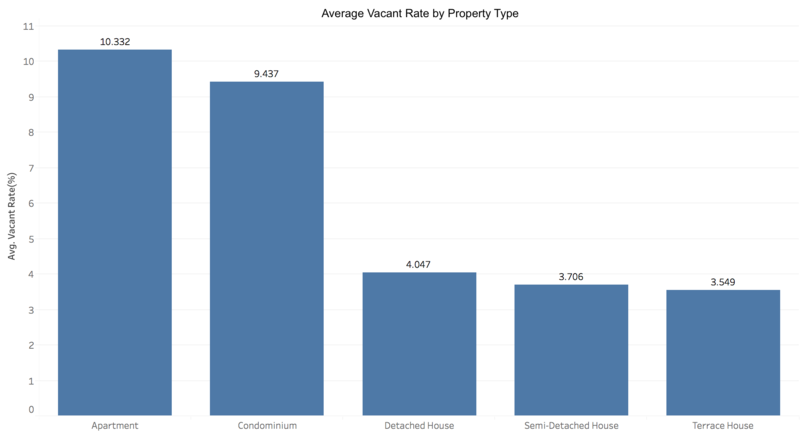
From the bar chart, it is observed that apartment has the highest vacancy rate, followed by condominium with 9.437% of vacancy rate.
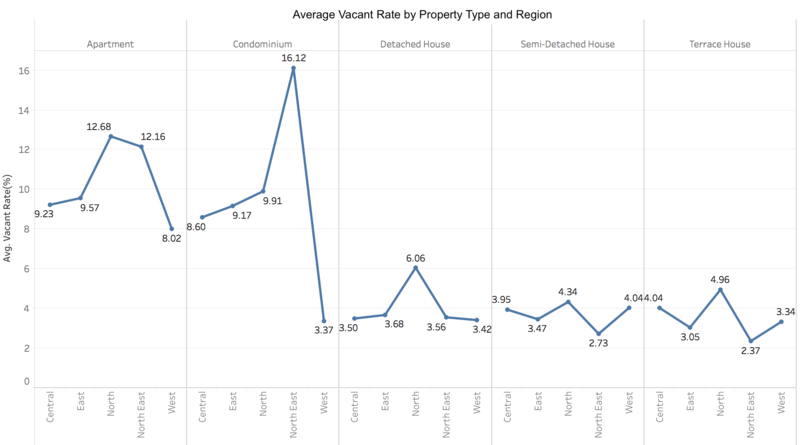
As we look further into the vacancy rate, condominium in the North East region has the highest average vacancy rate, which is about 5 times more than the average vacancy rate for condominiums in the West region.
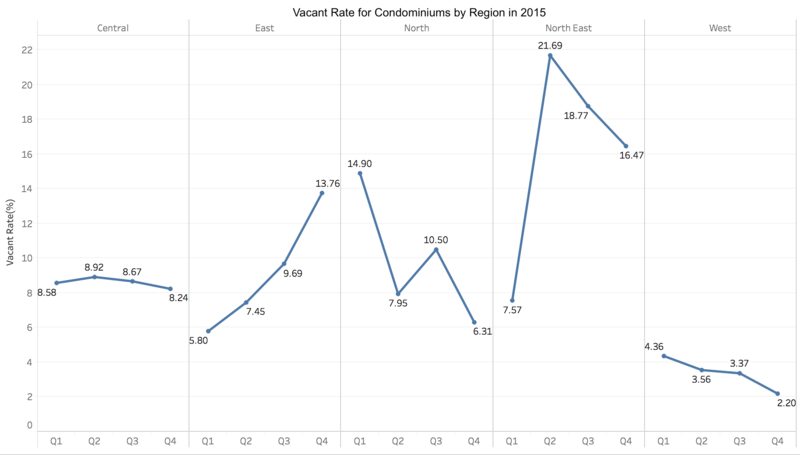
Hence, I have decided to focus on the vacancy rate of the different regions for condominium in Singapore. It is observed that the vacancy rate for condominiums in the North East and East region has been increasing across quarters in 2015, while the vacancy rate of condominiums in the West, Central and North region has been steadily decreasing.
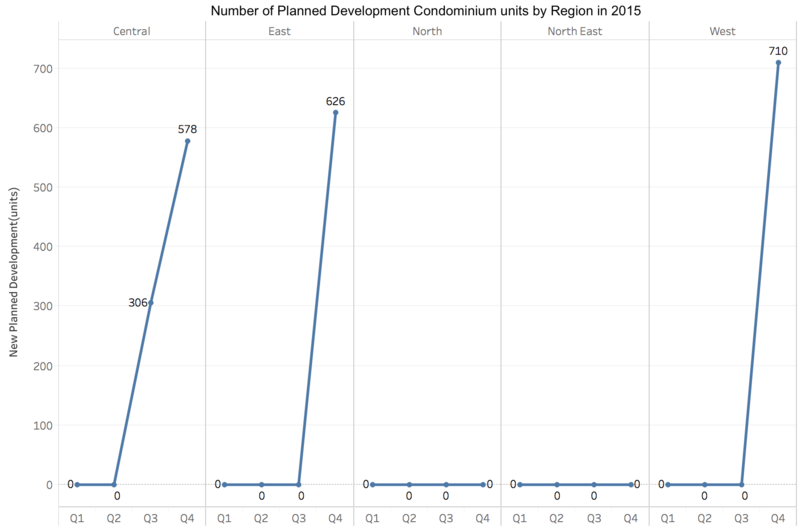
The graph above shows the number of planned development condominium units in the different regions. As we can see, Central and West region have increased the number of planned developments with the decreasing vacancy rate, and North East region has no planned development with the increasing vacancy rate. However, East region has increased the planned development despite the increasing vacancy rate and North region has no planned development although the vacancy rate has been dropping.
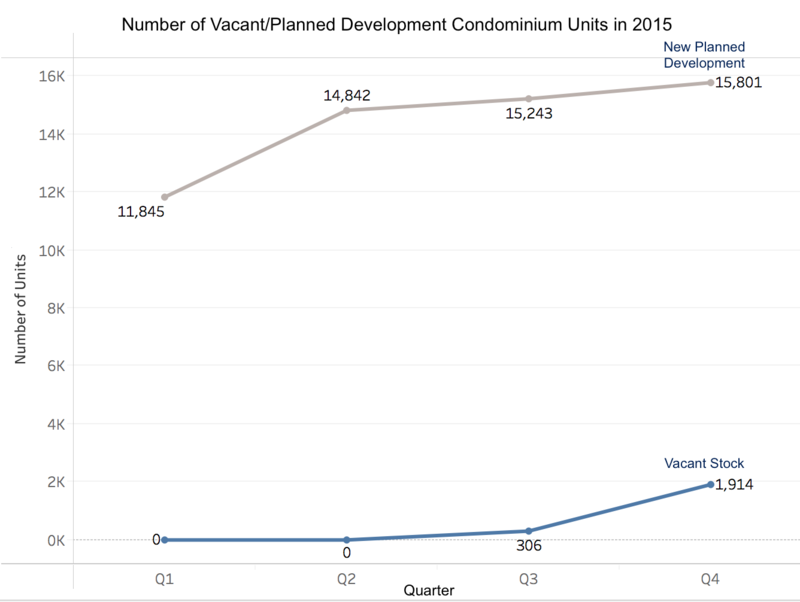
It has led to a growing number of new planned development units and an increasing number of vacant units, thus, causing an oversupply of condominiums.
Distribution of the private properties prices in 2015
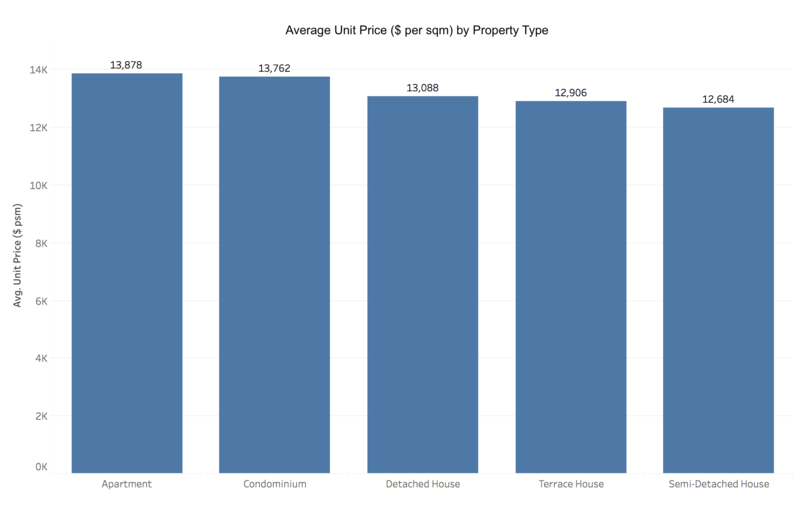
Looking at the prices of the different property types in Singapore, the average unit price per square metre is the highest for condominiums.
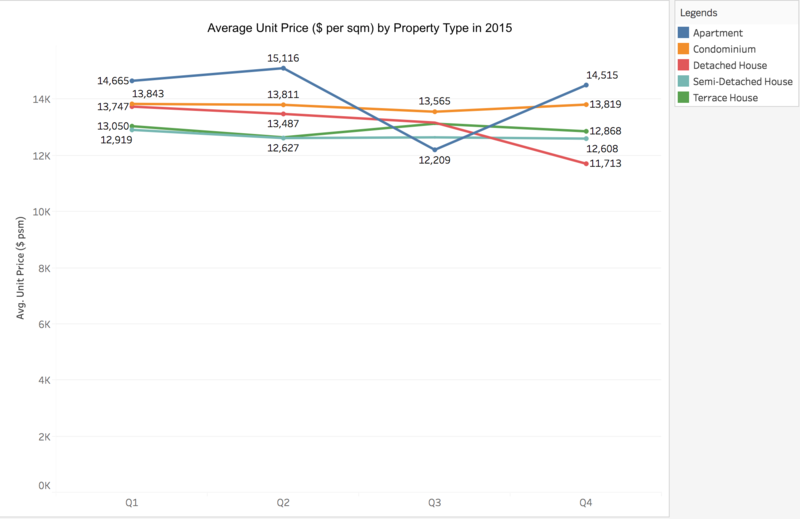
All property types faced a decrease in price. The average unit prices of detached houses decreased the most, at 14.80%, followed by terrace houses, at 9.33%. However, the average unit prices of apartment fluctuate the most whereas, other property types decrease steadily.
Tools Utilized
- Tableau
- Microsoft Excel
Conclusion
Supply
- Apartment has the highest vacancy rate, followed by condominium.
- Condominium in the North East region has the highest average vacancy rate, which is about 5 times more than the average vacancy rate for condominiums in the West region.
- There is an oversupply of condominiums.
Prices
- The average unit price per square metre is the highest for condominiums.
- All property types faced a decrease in price.
- The average unit prices of apartment fluctuate the most whereas, other property types decrease steadily.
Recommendation
- The supply of condominiums has to be managed in 2016, especially in the East and North region.
- The government should control the decrease in private property prices, as it might lead to a drop in investment.
- There is a relative high rate of vacancy, hence the government should also take up measures to boost demand.
