IS428 2016-17 Term1 Assign3 Aaron Mak Kang Sheng
What are the typical patterns in the prox card data? What does a typical day look like for GAStech employees?
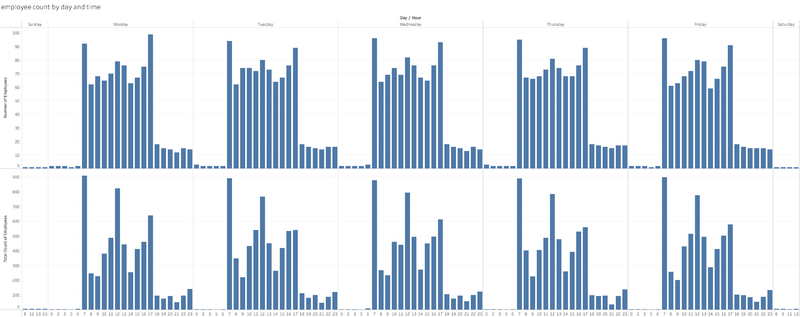
Most GAStech employees do not come back on weekends. The exceptions are anomalies. Their day generally starts at 7am and ends at 5pm. Only a few employees stay past 5pm to work, most likely working overtime. There is a lot of movement at 12 which suggests that they many employees go for lunch during that time.
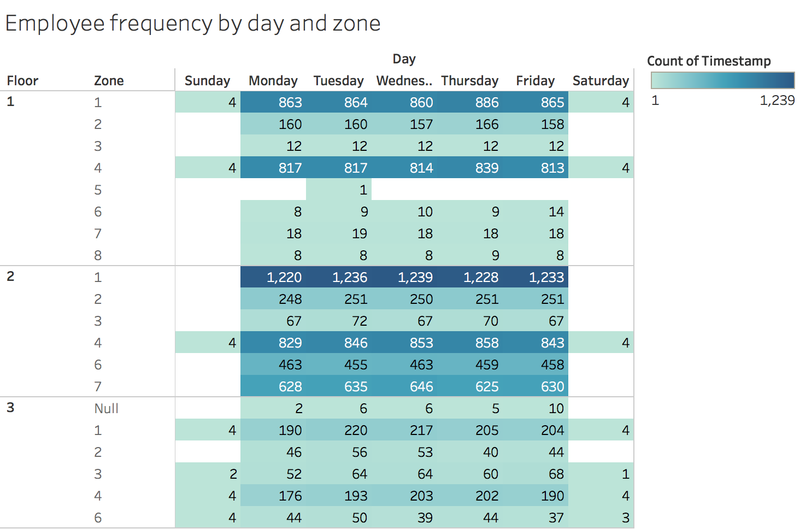
From the above graph, you can see that the zones with the most movement are expectedly the zones with the elevator/stairs (Floor 1 Zone 4, Floor 2 Zone 4, Floor 3 Zone 4) or the open area surrounding it (Floor 1 Zone 1, Floor 2, Zone 1, Floor 3 Zone 1). A good amount of employees also visit the Deli (Floor 1 Zone 2) before lunch and during lunch.
Describe up to ten of the most interesting patterns that appear in the building data. Describe what is notable about the pattern and explain its possible significance.
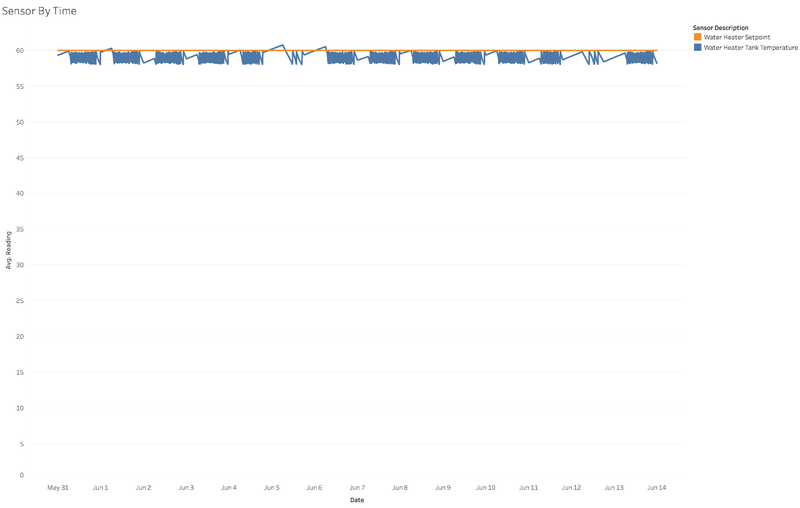
1. The ‘Water Heater Setpoint' sets the maximum temperature for the water in the water heater tank. So the water heater is shut off when the temperature reaches the ‘Water Heater Setpoint’.
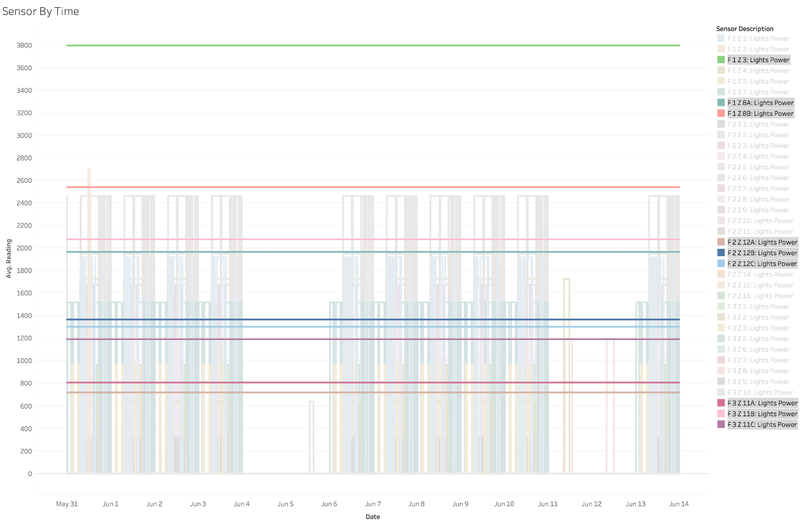
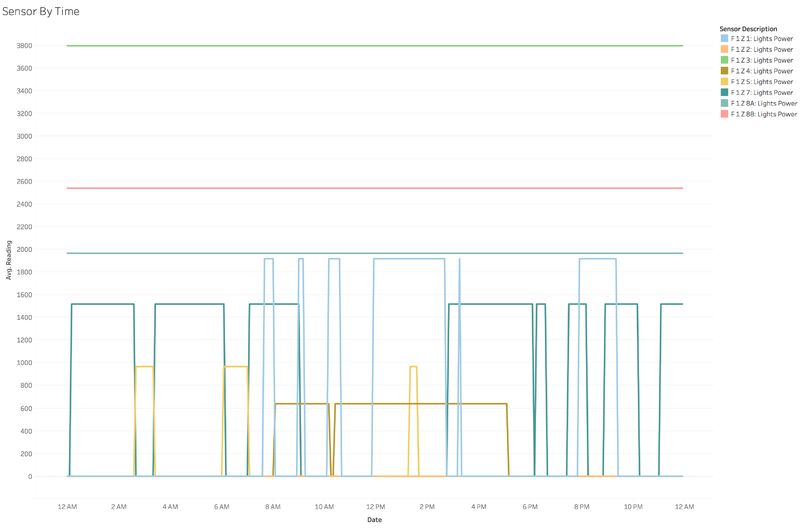
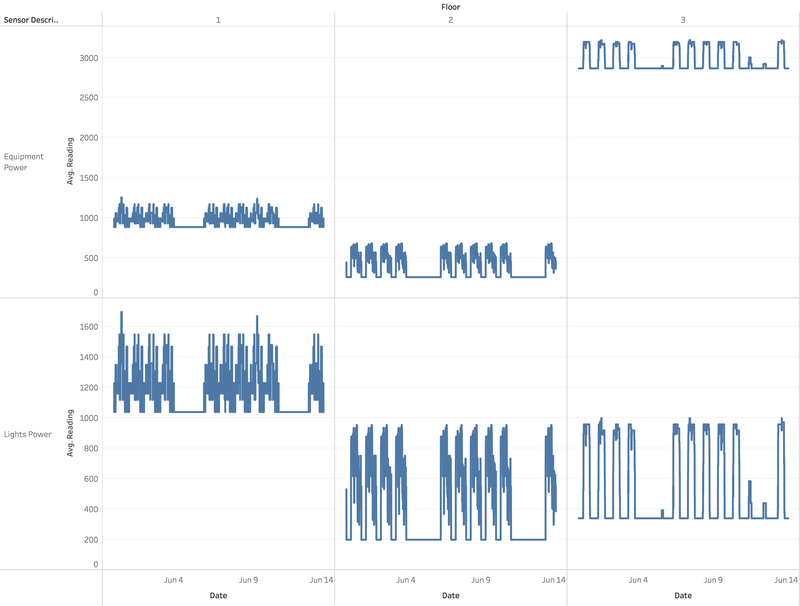
2. Only lights in the corridors and the main entrance are permanently switched on. From the graph below, the lights with consistent power are either in the corridors or the main entrance.
3. The light power data could also suggests that the lights that are not in the corridor or the main entrance are activated by sensors. Zooming in to a day’s data on level 1, we can see that the lights could be switched off for short periods of time. This pattern is recurrent when looking at other days or floors.
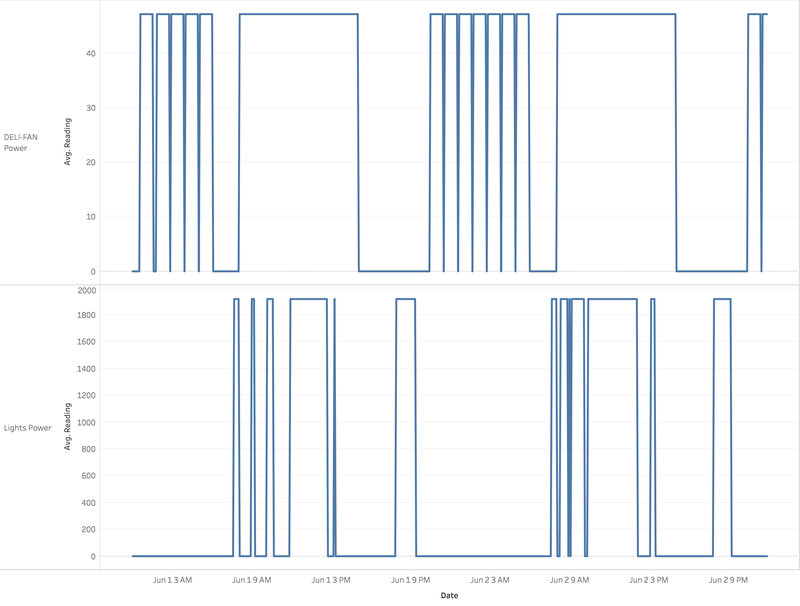
4. Deli fan is switched on at regular intervals, unlike the lights in the same zone which are only switched on periodically. This could suggest that the fan is switched on based on a schedule whereas the lights are switched on manually or by motion detectors.
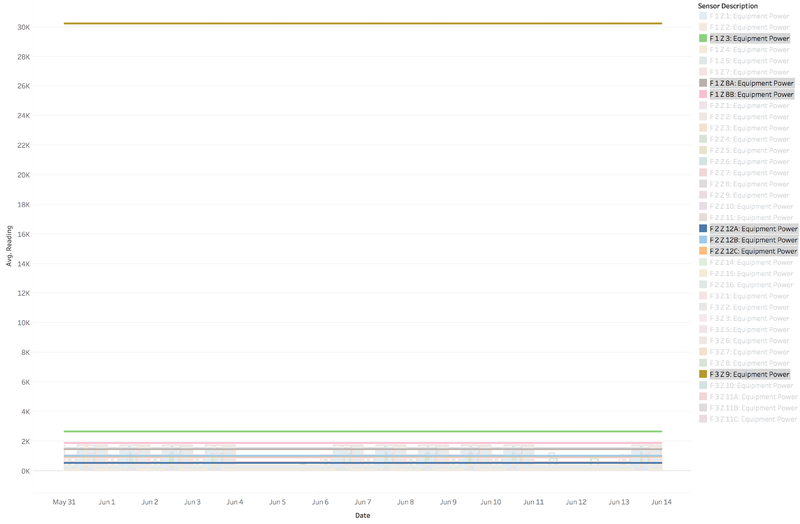
5. Equipment power is switched on permanently for corridors, the main entrance and the server.
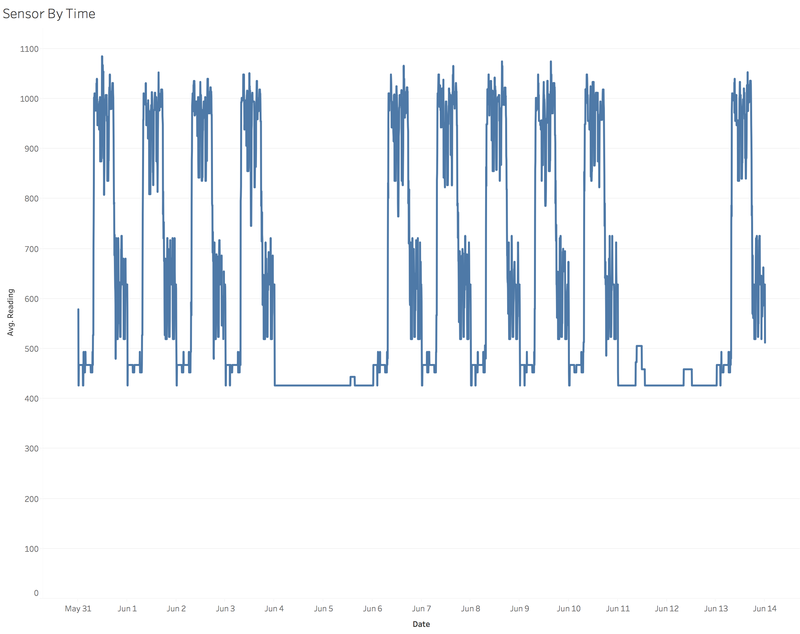
6. The lights power is higher the more employees are in the building, as expected. On weekends, the lights power is lowest. During normal working hours, the lights power is highest.
7. Level 3 seems to use much more equipment power than light power while level 1 seems to use much more light power than equipment power.
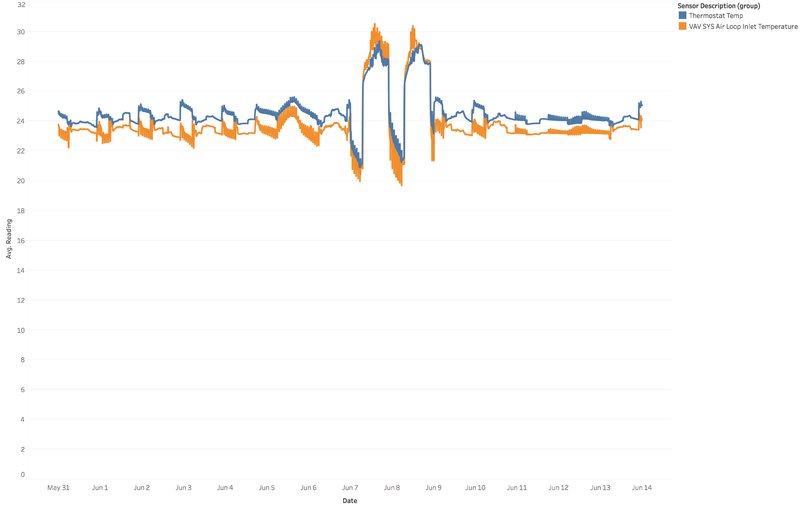
8. The thermostat temperature and VAV System Air Loop Inlet Temperature is similar which suggests that the air from the VAV System affects the room temperature to a large extent.
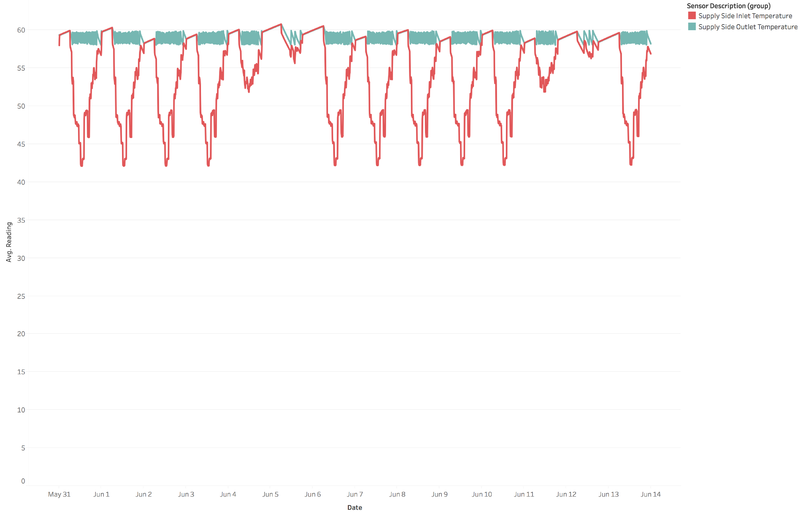
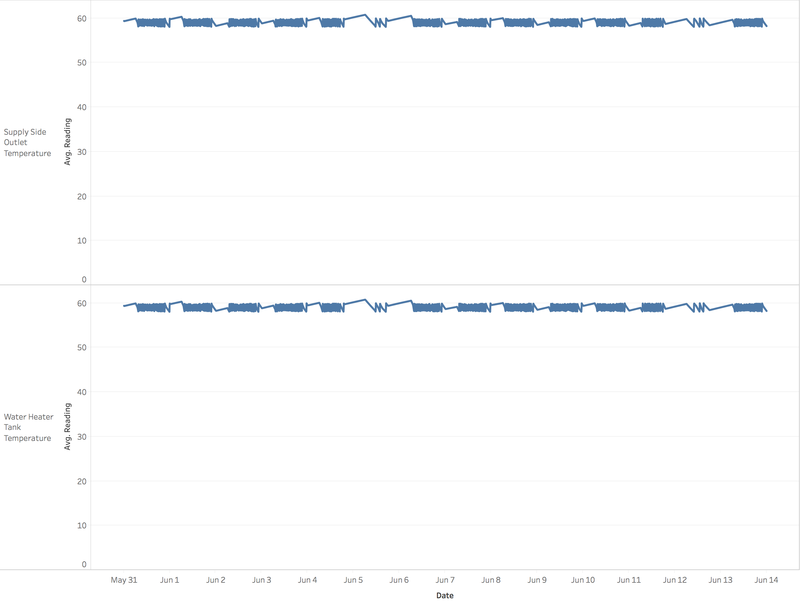
9. There are 2 observations which help me to deduce that the supply side inlet and outlet is linked to the water heater tank. The supply side inlet temperature goes down when the supply side outlet temperature is sustained. This suggests that some sort of heat transfer is taking place. The supply side outlet temperature is identical to the water heater tank’s temperature.
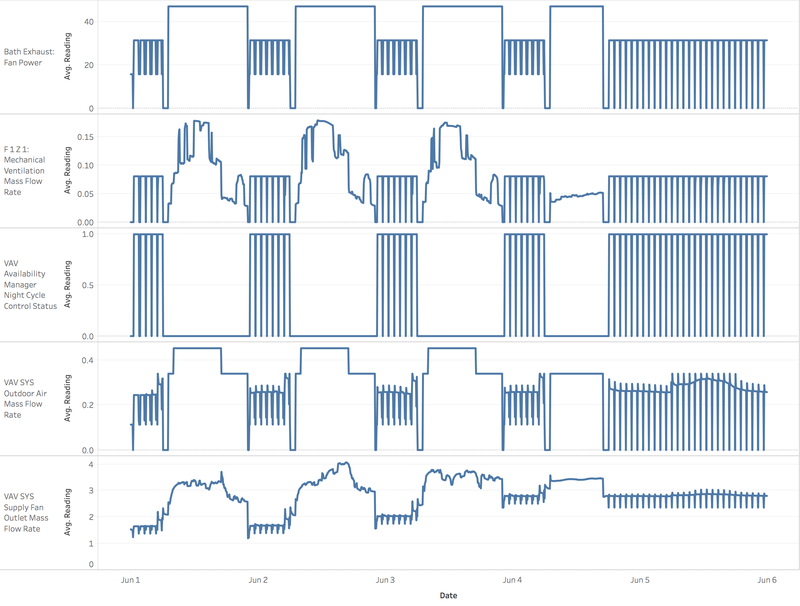
10. According to the VAV availability manager night cycle control status, it seems that there’s some sort of relationship between the airflow and the status of the night cycle control status. Upon looking it up online, it is quite likely that the availability manager night cycle control status affects the airflow of the building.
Describe up to ten notable anomalies or unusual events you see in the data. Prioritize those issues that are most likely to represent a danger or a serious issue for building operations
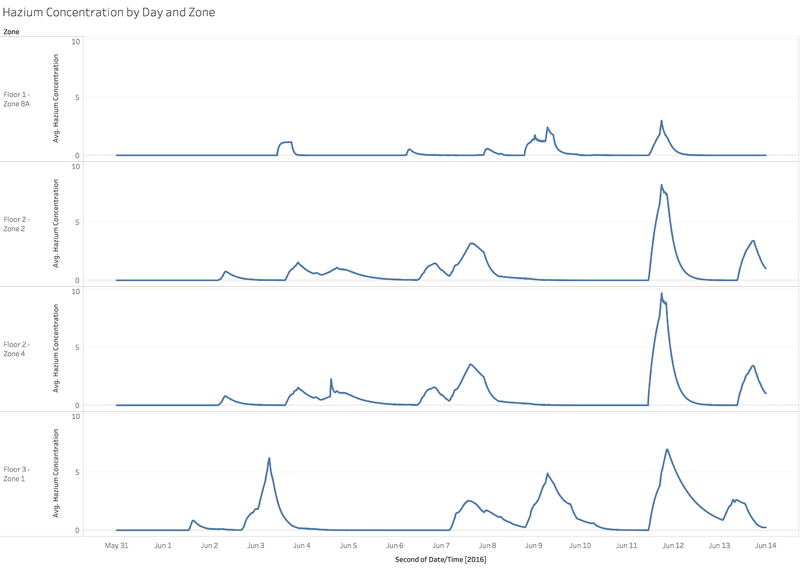
1. Hazium concentrations are highest for all 3 floors on 11 June, evening. On 7am, 3rd June and 7am, 9 June, Floor 3 Zone 1 has a spike in Hazium concentrations. This suggests that it was dangerous for the employees during those times to remain in that building zone.
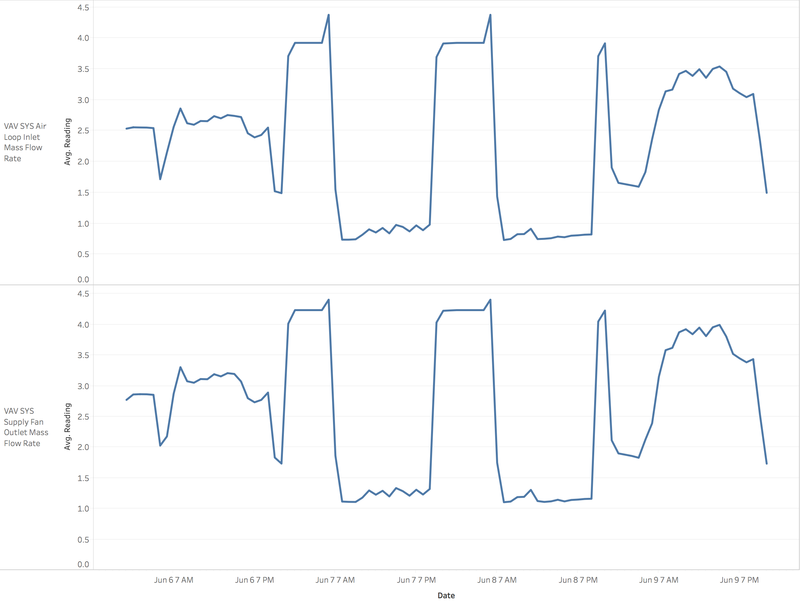
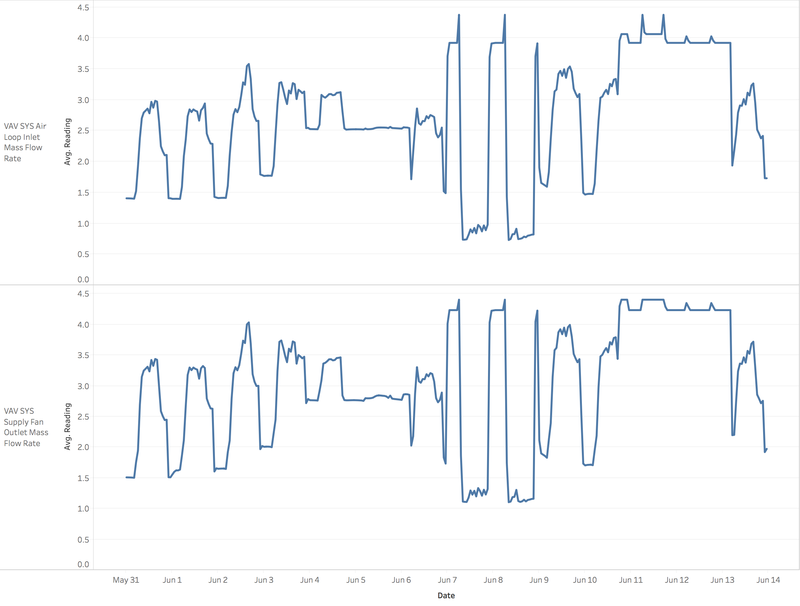
2. The air loop inlet mass flow rate and the supply fan outlet mass flow rate is at an all-time low on 7 and 8 June from 8AM - 9PM. This suggests that the air circulation is extremely poor during working hours on 7 and 8 June.
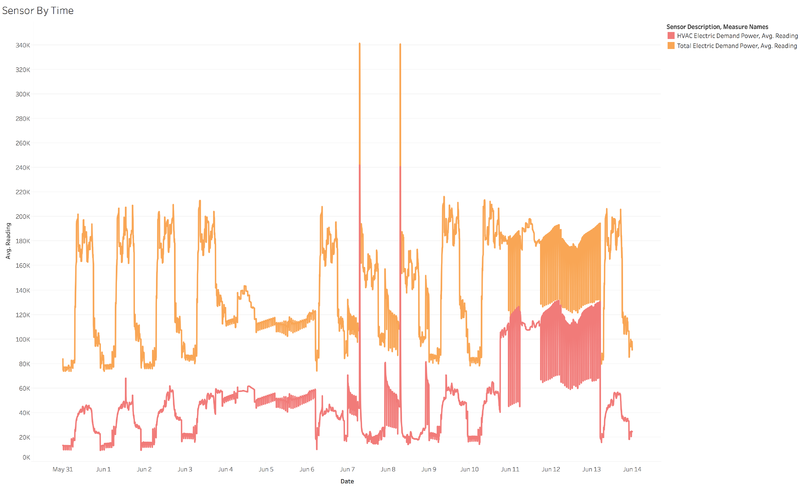
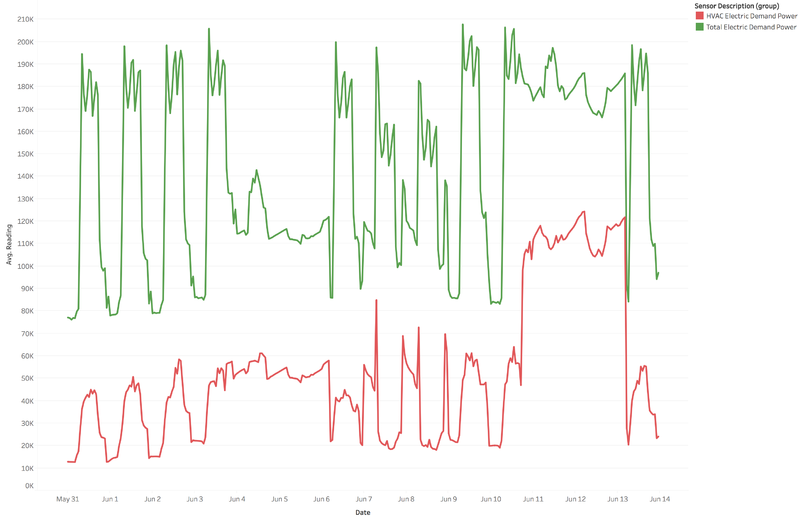
3. Electricity usage spiked suddenly on 7 June and 8 June, 7.05AM. This suggests some sort of short circuit during those times.
4. Electricity usage was extremely high for a weekend of 11 to 12 June.
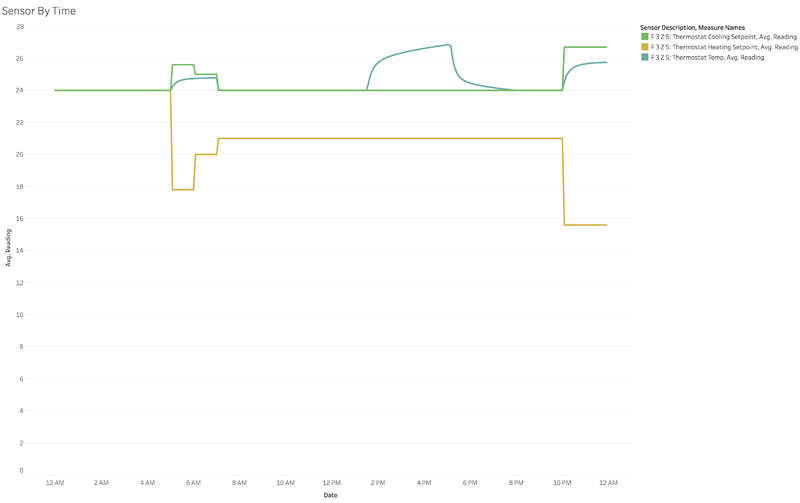
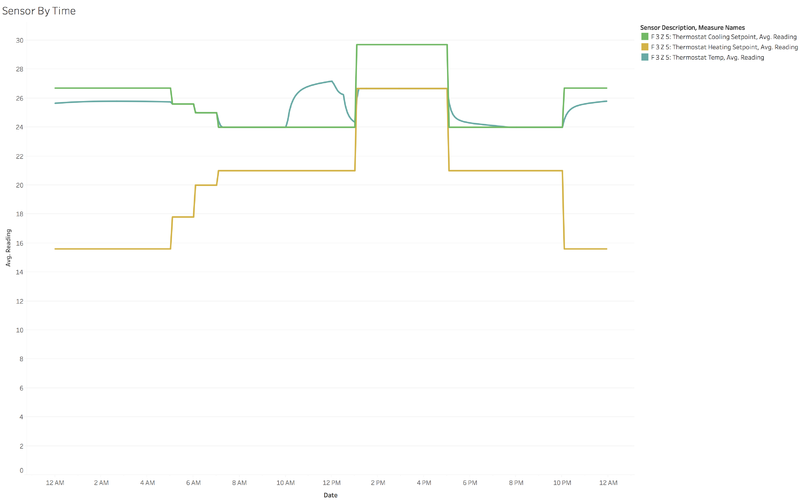
5. Floor 3 Zone 5 Thermostat Temp reading was higher than the cooling set point on 2 days (1 Jun and 13 June) suggesting that the cooling system is faulty.
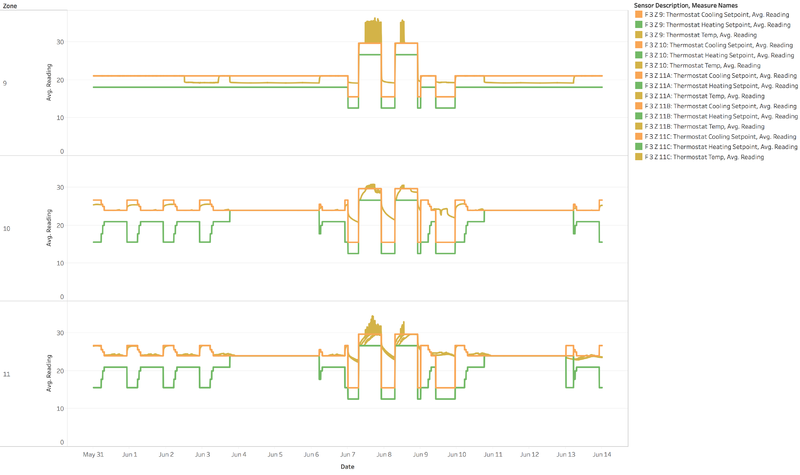
6. On 7 and 8 June, the thermostat temperature in Floor 3 Zone 9, 10, 11A, 11B and 11C is higher than the thermostat cooling setpoint, suggesting that the air-conditioning is not working.
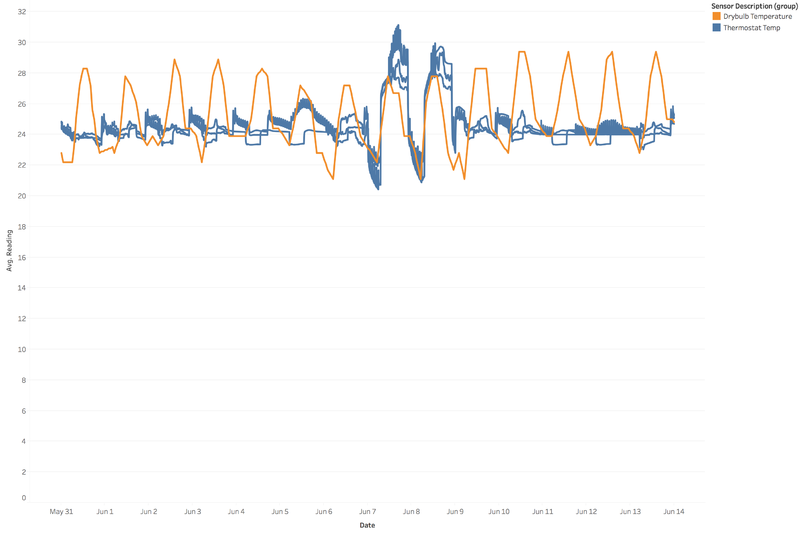
This is further proven by the thermostat temperature corresponding to the dry bulb temperature on 7 and 8 June which also suggests that the air-conditioning is not working.
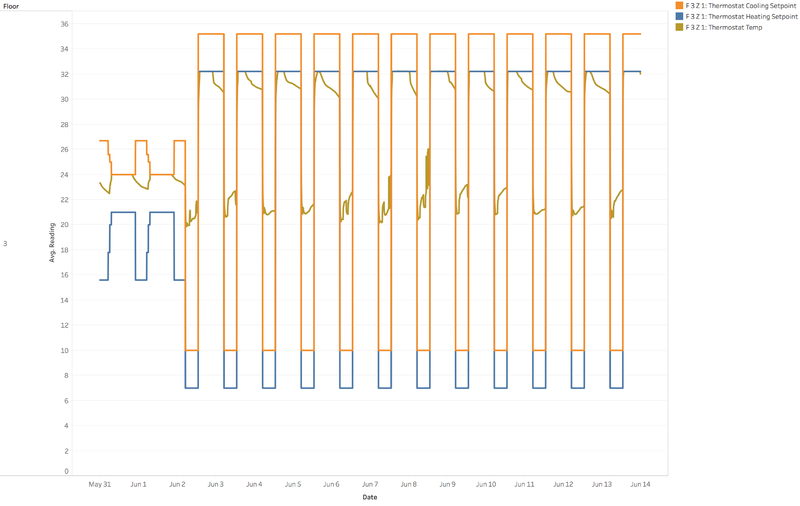
7. Either the Floor 3 Zone 1 thermostat is faulty or the thermostat cooling set point acts like the thermostat heating set point because the temperature seems to be lowered when the temperature reaches the heating set point and increased when the temperature reaches the cooling setpoint.
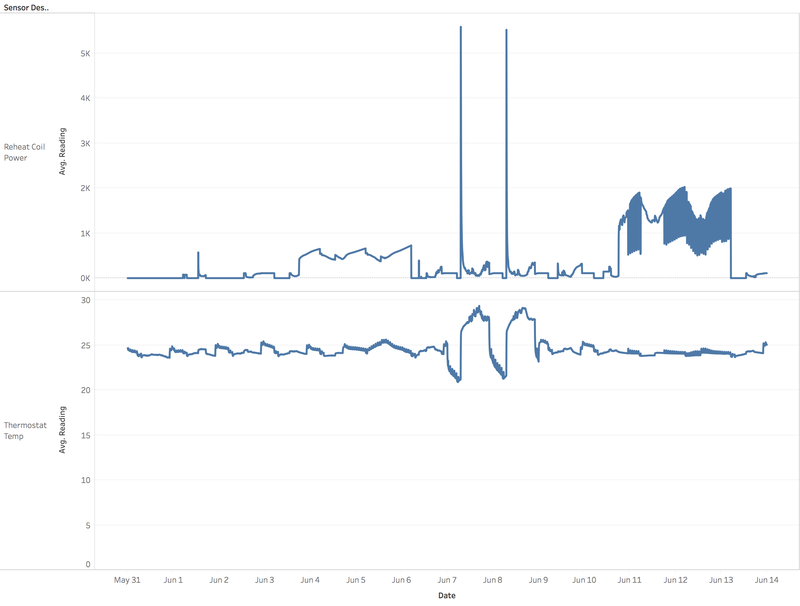
8. The reheat coil power spiked on 7 and 8 Jun at 7:05AM on each day. The thermostat temperature also spikes at the same time on both days. This suggests that the reheat coil could be the culprit for the spike in temperature.
