IS428 2016-17 Term1 Assign3 Wang Ziteng
Problem & Motivation
After the successful resolution of the 2014 kidnapping at GAStech’s Abila, Kronos office, GAStech officials determined that Abila offices needed a significant upgrade. At the end of 2015, the growing company moved into a new, state-of-the-art three-story building near their previous location. Even though the employee morale rose somewhat with the excitement of the new building, there are still a few disgruntled employees in the company.
Based on the data collected from sensors and prox card readers, we can get insights on employees' movements and how to prevent danger for building operations.
Data Preparation
-Issue 1:
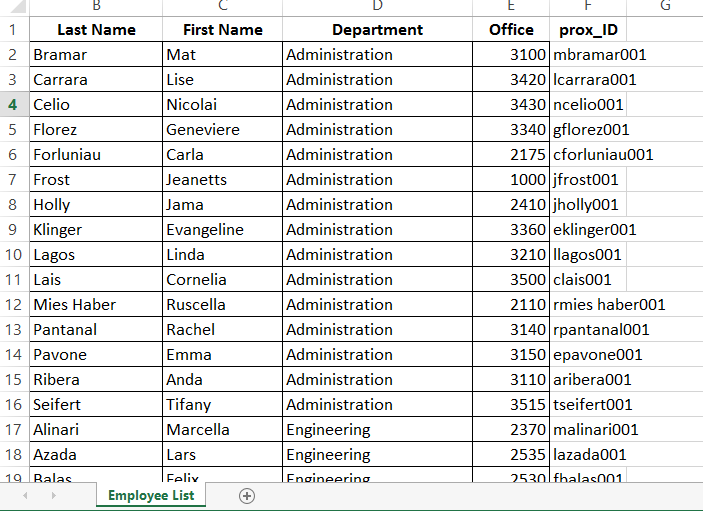
To link the EmployeeList with proxMobileOut and proxOut csv file, I add a column to the EmployeeList called proxID. From observation, the proxId is the first character of the first name combined with the last name and 001.

-Issue 2:
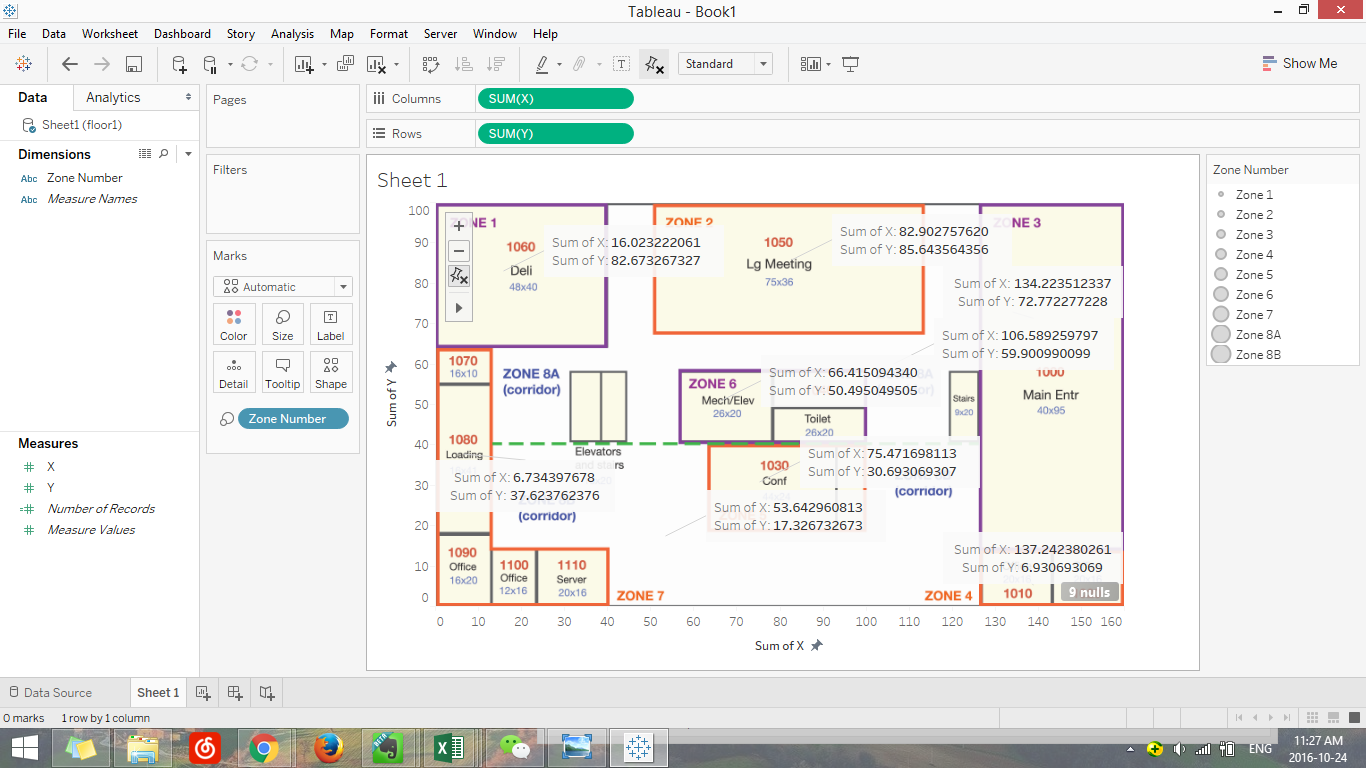
The data from proxMobileOut and proxOut, although they represent same kind of data, the format are slightly different. proxMobileOut use x,y value to
locate the user, while proxOut use the number of zone.
I add the floor image to Tableau and adjust the number of X and Y according to the number in Excel file. Then I estimated the x, y value pair of each zone for all three floors.

Task
1. What are the typical patterns in the prox card data? What does a typical day look like for GAStech employees?
2. Describe up to ten of the most interesting patterns that appear in the building data. Describe what is notable about the pattern and explain its possible significance.
3. Describe up to ten notable anomalies or unusual events you see in the data. Prioritize those issues that are most likely to represent a danger or a serious issue for building operations.
4. Describe up to five observed relationships between the proximity card data and building data elements. If you find a causal relationship (for example, a building event or condition leading to personnel behavior changes or personnel activity leading to building operations changes), describe your discovered cause and effect, the evidence you found to support it, and your level of confidence in your assessment of the relationship.