IS428 2016-17 Term1 Assign3 Aaron Mak Kang Sheng
What are the typical patterns in the prox card data? What does a typical day look like for GAStech employees?
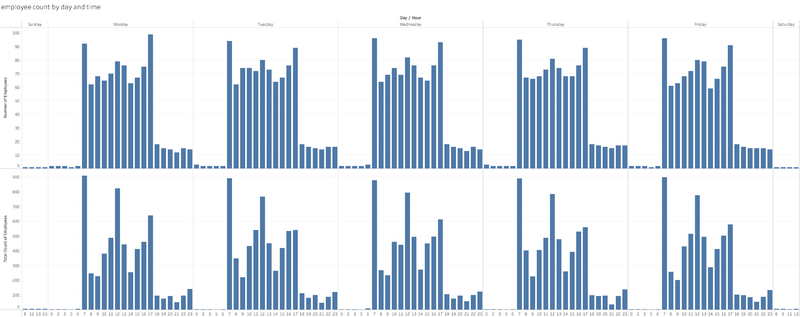
Most GAStech employees do not come back on weekends. The exceptions are anomalies. Their day generally starts at 7am and ends at 5pm. Only a few employees stay past 5pm to work, most likely working overtime. There is a lot of movement at 12 which suggests that they many employees go for lunch during that time.
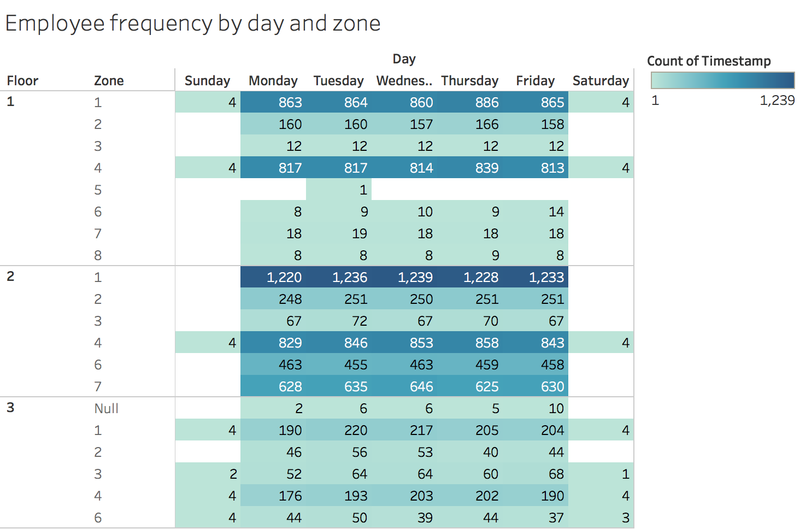
From the above graph, you can see that the zones with the most movement are expectedly the zones with the elevator/stairs (Floor 1 Zone 4, Floor 2 Zone 4, Floor 3 Zone 4) or the open area surrounding it (Floor 1 Zone 1, Floor 2, Zone 1, Floor 3 Zone 1). A good amount of employees also visit the Deli (Floor 1 Zone 2) before lunch and during lunch.
Describe up to ten of the most interesting patterns that appear in the building data. Describe what is notable about the pattern and explain its possible significance.
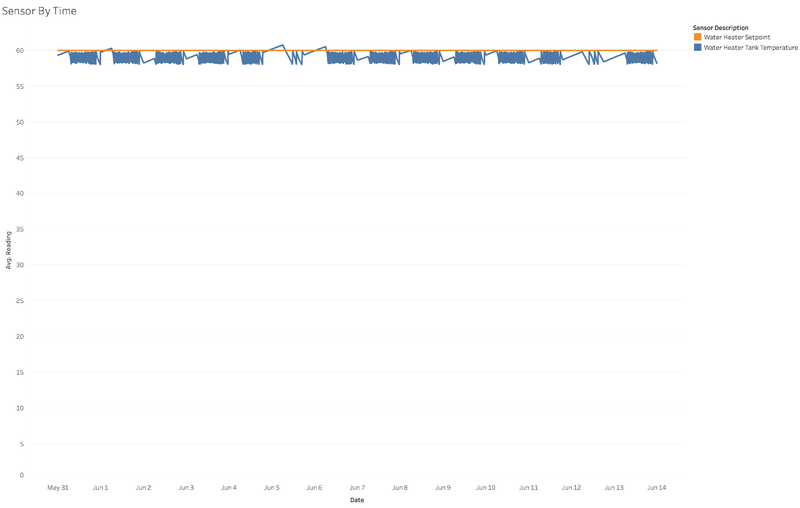
1. The ‘Water Heater Setpoint' sets the maximum temperature for the water in the water heater tank. So the water heater is shut off when the temperature reaches the ‘Water Heater Setpoint’.
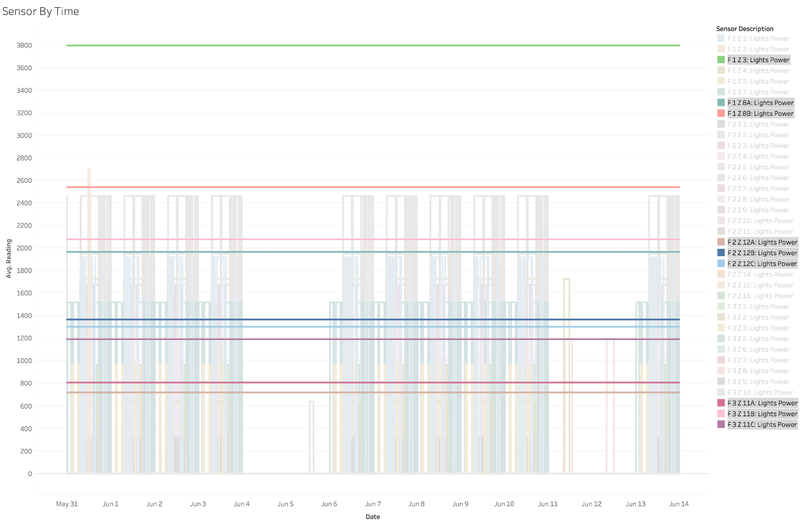
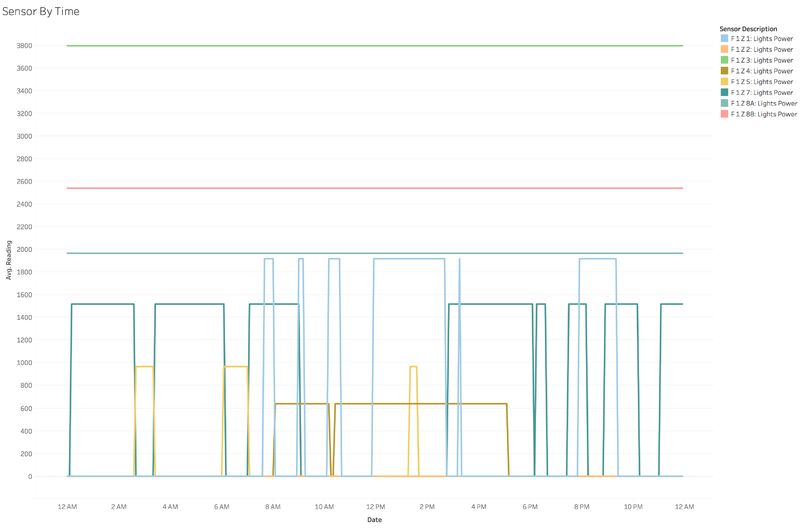
2. Only lights in the corridors and the main entrance are permanently switched on. From the graph below, the lights with consistent power are either in the corridors or the main entrance.
3. The light power data could also suggests that the lights that are not in the corridor or the main entrance are activated by sensors. Zooming in to a day’s data on level 1, we can see that the lights could be switched off for short periods of time. This pattern is recurrent when looking at other days or floors.
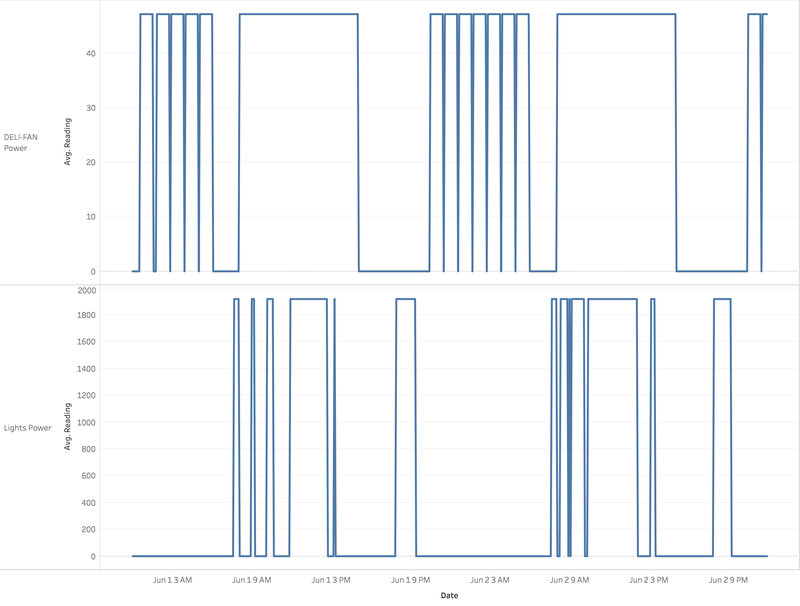
4. Deli fan is switched on at regular intervals, unlike the lights in the same zone which are only switched on periodically. This could suggest that the fan is switched on based on a schedule whereas the lights are switched on manually or by motion detectors.
