IS428 2016-17 Term1 Assign3 Lim Hui Ting
Contents
- 1 Overview
- 2 Data Preparation
- 3 1. Typical Patterns in the Prox Card Data
- 4 2. Interesting Patterns that Appear in the Building Data
- 5 3. Anomalies or Unusual Events Observed in the Data
- 6 4. Observed Relationships Between Proximity Card Data and Building Data Elements
Overview
In this assignment, we seek to help GAStech to understand its operations data by using two weeks of building and prox sensors data. The objectives of this assignment are as follows:
1. What are the typical patterns in the prox card data? What does a typical day look like for GAStech employees?
2. Describe up to ten of the most interesting patterns that appear in the building data. Describe what is notable about the pattern and explain its possible significance.
3. Describe up to ten notable anomalies or unusual events you see in the data. Prioritize those issues that are most likely to represent a danger or a serious issue for building operations.
4. Describe up to five observed relationships between the proximity card data and building data elements. If you find a causal relationship (for example, a building event or condition leading to personnel behavior changes or personnel activity leading to building operations changes), describe your discovered cause and effect, the evidence you found to support it, and your level of confidence in your assessment of the relationship.
Data Preparation
Proximity Sensor Data
1. Create X and Y coordinates column for fixed-prox
2. Create zone column for mobile-prox
3. Clean out proxid column
4. Group timestamp to 15 minutes interval
5. Join proximity sensor data with employee dataset
HVAC and Hazium Data
1. Separate whole building data and zone specific data
2. Clean zone specific data columns
3. Stack zone specific data columns to a single column
4. Create floor and zone columns for zone specific dataset
1. Typical Patterns in the Prox Card Data
1.1 Overview
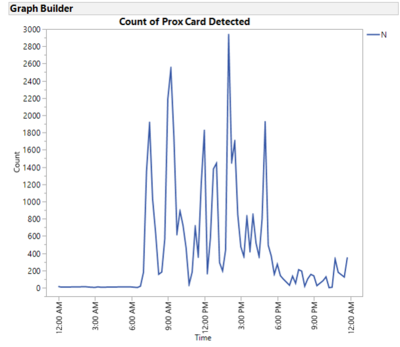
On a typical day of the week, there are 6 peaks in the prox card reader.
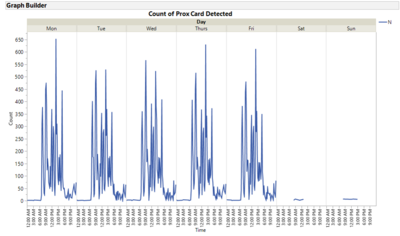
Weekdays have similar trend whereas weekends have similar trend. Weekdays peak:7.30am-7.45am,9.15am-9.30am,12pm-12.15pm,12.45pm-1pm,2pm-2.15pm,5pm-5.15pm. For Mon, Thurs and Fri, 2pm is the highest peak of the day whereas for Tue and Wed 9.15am and 2 pm peaks are quite similar in the number of occurrences.
1.2 Weekdays
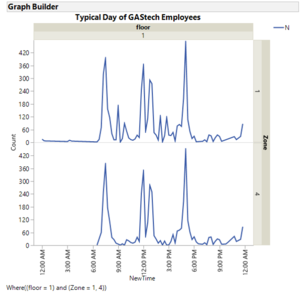
Since floor 1 zone 1 and 4 are the most common zones that employees will pass through, by looking at the time series graph of zone 1 and 4, we can observe that they have similar trends and share the same peaks at certain timings. With reference to zone 4 graph, the employees usually start work at 7.30am-7.45am as seen from the first peak. The second peak is at 12pm-12.15pm which is most likely the lunch time of the employees. Most of the employees are back from lunch time at 12.45pm-1pm as seen from the third peak. The last peak is at 5pm – 5.15pm which most likely indicate the employees knock off timing.
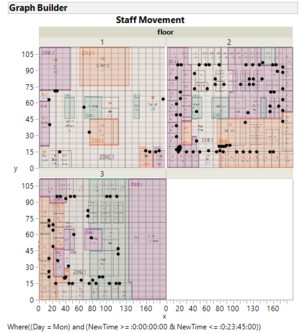
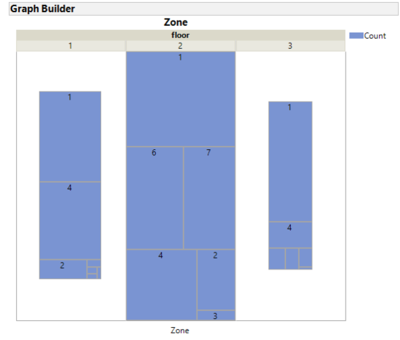
On Weekdays, there seems to have more staff movement on level 2 and 3 as compared to level 1. For Level 1, there are more staff movement in zone 1 and zone 4 and lesser staff movement in zone 8. For level 2, there are more staff movement in zone 1 and lesser staff movement in zone 3. For level 3, there are more staff movement in zone 1 and lesser staff movement in the server room.
1.3 Weekends
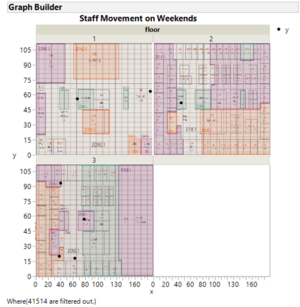
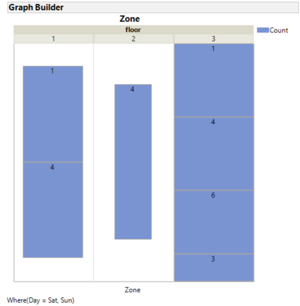
On weekends, Rosie will not be in operation and only fixed prox card readers are available. Floor 3 has more staff movement as the offices of the employees who came back to work on weekends are at level 3. For floor 2,only zone 4 is recorded which represents the elevator and stairs area. This means that the employees only stay within their floor area and do not wonder to other department offices.
2. Interesting Patterns that Appear in the Building Data
3. Anomalies or Unusual Events Observed in the Data
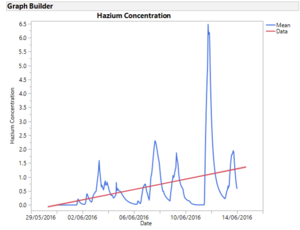
3.1 Abnormal Amount of Hazium Concentration
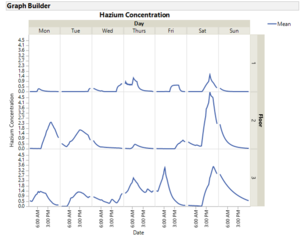
There is a sudden spike of hazium concentration on 11 June. This sudden increase in hazium concentration is most prominent on the second and third level. The amount of hazium seems to be increasing over these two weeks which might be a concern to GAStech as employees’ health will be affected if they are exposed to this potentially dangerous chemical for a long term.
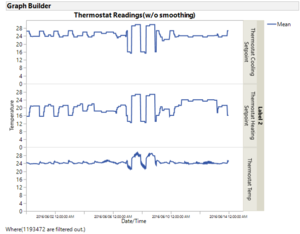
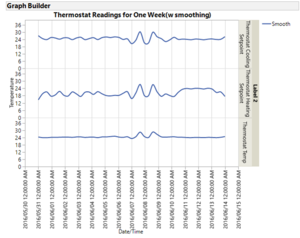
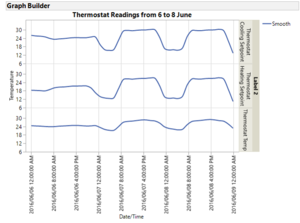
3.2 Abnormal Thermostat Readings
From thermostat readings, we can observed that GAStech is quite an environmental friendly company as it maintains its indoor temperature at about 24/25 degree Celsius. There is a sudden spike in the thermostat readings on 7 and 8 of June. In the wee hours of 7 and 8 of June, the thermostat cooling and heating setpoint decreases resulting in a drop in the office temperature. The employees who came to work the next day might find the temperature too cold such that they adjust the heating and cooling setpoint higher than their usual setpoints. The gradual decrease in the cooling and heating setpoint might be a result of faulty thermostat which require further investigations.
