IS428 2016-17 Term1 Assign2 Tan Yong Kiong Alson
Contents
Data Visualisation
The URL link of the data visualisation dashboard using Power BI Desktop can be found here. [1]
Abstract
Under the Ministry of Manpower, Singapore, the Workplace Safety and Health (WSH) Act is an essential part of a framework to cultivate good safety habits in all individuals, so as to create a strong safety culture in workplaces. The WSH statistics, which are reported and published every mid-year and full-year, provides the latest findings on the workplace safety and health performance in Singapore. The data used were collated from incident reports made employers, occupiers and medical practitioners in the fulfillment of their obligations under Singapore's Workplace Safety and Health Act and Workplace Safety and Health (Incident Reporting) Regulations.
This report aims to explore the workplace injuries which happened in 2014 under the purview of Ministry of Manpower, specifically analyzing the probability of injuries across different demographics such as gender, age and type of industry. By executing the initial investigation, more specific questions will be surfaced and further analysis will be conducted to answer the questions. The results and interpretations will be shown in the form of a web-based interactive data visualization system for public to view and allow users delve into particular issues.
Problem and Motivation
To ensure that the Workplace Safety and Health Act is regulated effectively, it has highlighted the responsibilities of different stakeholders, such as employers, occupiers and employees. Employers have to ensure a safe working environment and conduct regular risk assessments to identify hazards. They also have to ensure workers are provided with sufficient instruction, training and supervision so that they can work safely. As for the employees, they are required to follow the workplace safety and health system and safe work procedures.
In a commemorative book [2] published by the Occupational Safety and Health (OSH) Division last year, Prime Minister Mr Lee Hsien Loong mentioned that even one workplace injury is one too many, and economic progress should not come at a cost of compromising the worker's safety and health. This comment is echoed by Minister for Manpower, Mr Lim Swee Say, who announced a call to action by implementing Vision Zero, to create safer and healthier workplaces for all workers in Singapore.
Building on the government's objectives to create a hazard-free Singapore, this report serves to explore the fundamental reasons behind the 5,651 workplace injury cases that happened in 2014. The dataset is rich in terms of the demographic aspects, which answers where and at how old did the workers sustain the injuries, and the psychological aspects, such as at what possible mental condition did they sustain the injuries. These results help the Singapore government to implement workplace policies which will help reduce the occurance of occupational injuries in the future.
Below are the initial questions that this report will be exploring:
- Are certain demographics of the population (e.g. gender, age) more vulnerable to workplace injuries than others?
- Are certain areas of Singapore more prone to workplace injuries than others?
- Are certain industries more prone to workplace injuries than others?
First, knowing the probability of particular demographic which are more prone to workplace injuries allow us to understand their knowledge of and their mentality in dealing with workplace safety. For example, for some demographics, they may be over-zealous and place less emphasis on workplace safety compared to others. Second, solving the question on geographical location can concentrate the workplace injury prevention and education to certain areas, which face higher risk of injuries than others. For example, these locations may include labor-intensive industrial estates which involves the use of heavy machinery. Third, it will help companies from similar industries which are accident-prone share knowledge and expertise on how to better prevent workplace injuries in future.
Approaches
First, data cleaning was done on Microsoft Excel 2016 to eliminate unnecessary and clean up the dirty data within the spreadsheet.
- For example, the SUBSTITUTE function was applied on Accident Agency Level 2 Desc to clean up the excess text at the beginning of the description, which is the Accident Level 1 Desc. Similar executions are done on the Sub Industry (SSIC 2010) field. An example of this is found on Figure 1. This is to ensure that dataset within the fields are reflected independently from their major groups for appropriate and meaningful analysis.
- In addition, since the postal code by district is given in numerical form, it is transformed in the form of specific locations and regions to enable clearer visualisation of the workplace safety situation in Singapore. The list of postal districts and general location can be found on the URA website [3]. The regions according to the respective districts can be found through Key Location [4]
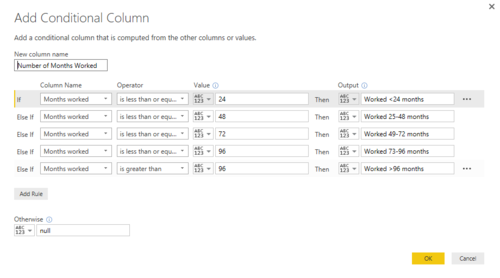
Further cleaning was done on the Power BI toolkit to suit the different charts and purposes. Using the Query Editor of Power BI, binning of continuous values can be done on the dataset. This will allow better analysis of the various demographics and psychographic aspects. An example is shown on Figure 2.
Tools Used
The following tools are used to create the data visualization:
- Microsoft Excel 2016
- Power BI Desktop
Results
The sunburst diagram gives us very detailed information of the demographics in terms of gender and age, as well as the occupation of the workers who suffered workplace injuries. This will allow us to have a better insight of the possible factors that contributed to the risk of potential workplace injuries.
For example, we know that about a quarter of all injuries are caused by male workers aged between 21-42, who worked for less than 2 years. They were also carrying out official duties, not doing overtime, working morning shift, and have a job scope which involved manual labour for more than 50%. From this, we may infer that male workers aged between 21-42 tend to be over-zealous in the course of their work, leading to potential injuries in their respective fields.
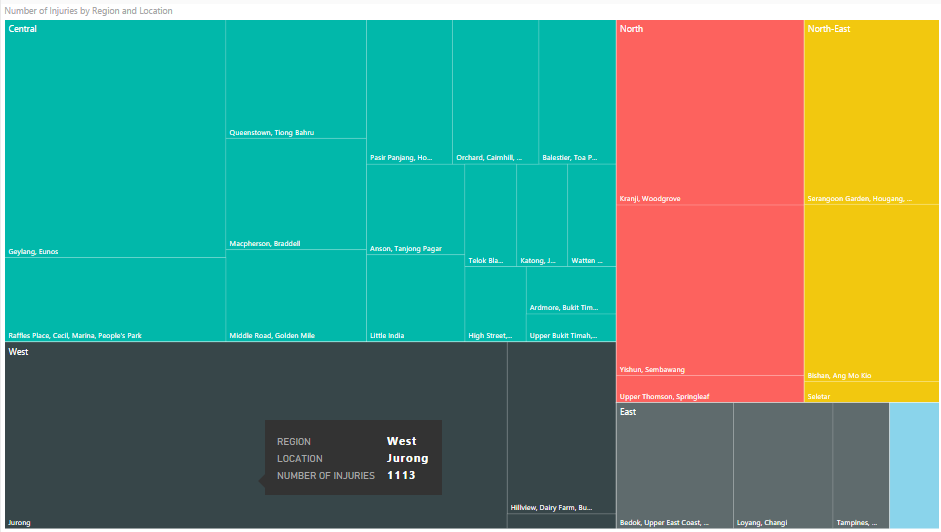
Secondly, through the treemap diagram, we are able to zoom in on the "hotspots" in Singapore where most of the workplace injuries happen. For example, we can understand that although the Central Region is the region where most accidents take place, the Jurong area in the West Region is most prone to workplace incidents. This could be due to the bulk of injuries that occured in the Jurong Industrial Estate, where most of the heavy machinery factories are located. Hence, authorities should step up on promoting injury prevention to the workers there to avoid more mishaps from happening.
Thirdly, the scatter plot shows a big picture of the major and sub industry that contributes to workplace injuries. As we can see, the construction industry takes up the largest pie of incidents in Singapore, while the average number of years that they worked before encountering an accident is about 2.1 years. On the other hand, employees from the public administration and defence waited about 10 years on average before facing an injury, according to the data. From these, we know that the risk of injury occurrence differs greatly from one industry to another, where blue-collar, labor-intensive workers have a higher chance of workplace injuries than white-collar, knowledge-intensive workers.
Next, the parallel coordinates chart shows a general correlation between the average number of MC days for each Accident Description, and its corresponding total number of injuries. This shows that the less serious injuries are actually more prevalent. For example, pressurized equipment cause the highest average number of MC days at 44, while the actual number of injuries stands at less than 200 cases.
Also, the treemap diagram shown above aims to tell a story on which body parts are most common amongst all the injuries. This happens to be the cust and bruises on the hands (1196). Hence, education can be stepped up by different industries on hand protection from possible injuries, including wearing safety gloves.
Lastly, the accident calendar can help to predict when will workers get involved and for what reasons. One of the most injury-prone days in 2014 is on 20 May, which had up to 35 cases. It would be interesting to note what happened on that particular day that led to the high number of injuries.


