IS428 2016-17 Term1 Assign2 Ong Ming Hao
Since we were able to make some changes before sunday. I decided to make some changes in order to better reflect the assignment. The changes that i made would be in red.
Contents
- 1 Theme
- 2 Analytical & Investigative Questions
- 3 Data Cleaning
- 4 Analysis
- 4.1 Which industry/sub-industry results has the highest number of workplace injuries?
- 4.2 Which parts of the body are most prone to injury and are they major?
- 4.3 Is an inverse correlation to workplace injury to experience?
- 4.4 Is an inverse correlation to workplace injury to age?
- 4.5 Final Insights Gained
- 5 DashBoard
- 6 Tools Used
- 7 Acknowledgements
Theme
Theme of Interest
In Singapore, Workplace safety is highly scrutinized on. If too much accidents occur in a workplace, the company may be shut down or be suspended. One way in which the Singapore Government help maintain a high level of Workplace safety is through workplace safety, is through strict laws and frequent spot checks. However, accidents do occur and this results in minor injuries, major injuries and sometimes fatalities. Although the number of fatalities in Singapore is still very little, something must be done to ensure that very little fatalities can occur in Singapore. As such, the goal of this analysis is to look at accidents that occur in Singapore to identify areas in which more safety laws and spot checks can focus on such areas to reduce injuries in the work place.
Reason for choice of Theme
By analysing previous trends, we are able to identify areas in which more safety checks, laws and spot checks so that safety in these places can be improved and thus, reducing any workplace injuries. Ultimately, so that we would be able to reduce the number of workplace injuries.
Analytical & Investigative Questions
- Which industry/sub-industry results has the highest number of workplace injuries?
- Which parts of the body are most prone to injury and are they major?
- Is an inverse correlation to workplace injury to experience?
- Is an inverse correlation to workplace injury to age?
Data Cleaning
For this analysis, I’ve used the dataset provided by the Workplace injuries data Provided by Singapore’s Workplace Safety and Health (WSH) Institute. This data consists of all the accidents recorded by WSH in the year 2014. The data can be retrieved from https://wiki.smu.edu.sg/1617t1IS428g1/img_auth.php/e/ed/WPI_data.xls
I’ve decided to clean the data so that when the data is visualised, it would be much clearer to the audience who views it. This is what I did.
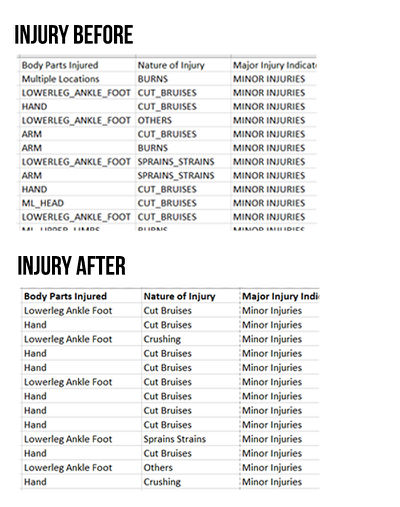
Easier for viewers to read
The data which was found on the dataset was not properly cleaned and would be harder for viewers to understand the visualisation. As such, I edited some of the data such that it would be easier for them to understand.
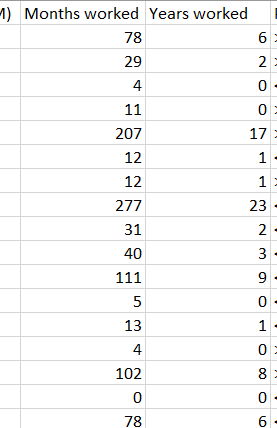
Include a Years Worked
The data that was found on the dataset only had the number of months each individual worked. Since I wish to analyse the experience of each individuals in a clear and accurate manner, I have to convert the months to years.
Analysis
Which industry/sub-industry results has the highest number of workplace injuries?
By doing answering this question, I would have an idea of which industry/sub-industry have most workplace injuries, as well as having an overview of all the workplace injuries across all industries and sub-industry.
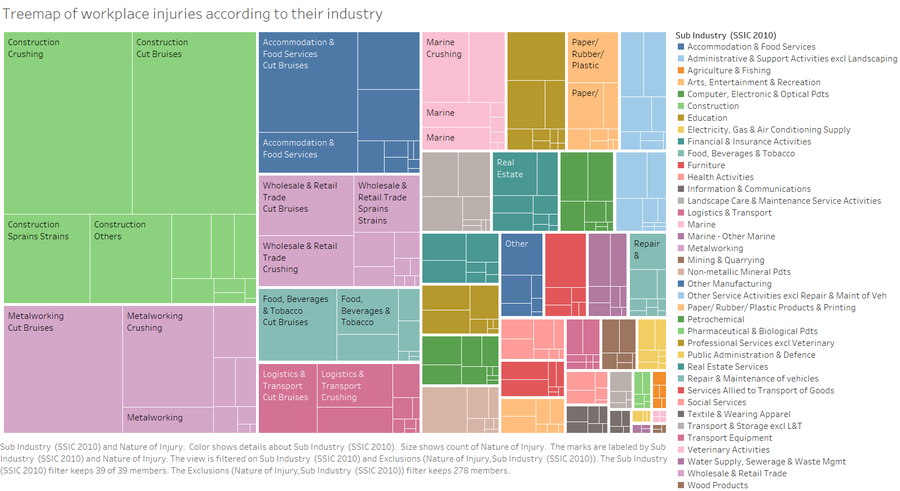
As such, I plotted a Treemap all the workplace injuries according to their industry as well as the broken then down according to the various types of injuries. Once I plotted the Treemap, I realised that there is an “Others” Industry and sub-industry. Since this information does not tell us anything, I’ve decided to exclude this data out of my dataset, leaving me with this.
Through this graph, I was able to identify that Construction has the highest number of workplace injuries, followed by Metalworking.
Which parts of the body are most prone to injury and are they major?
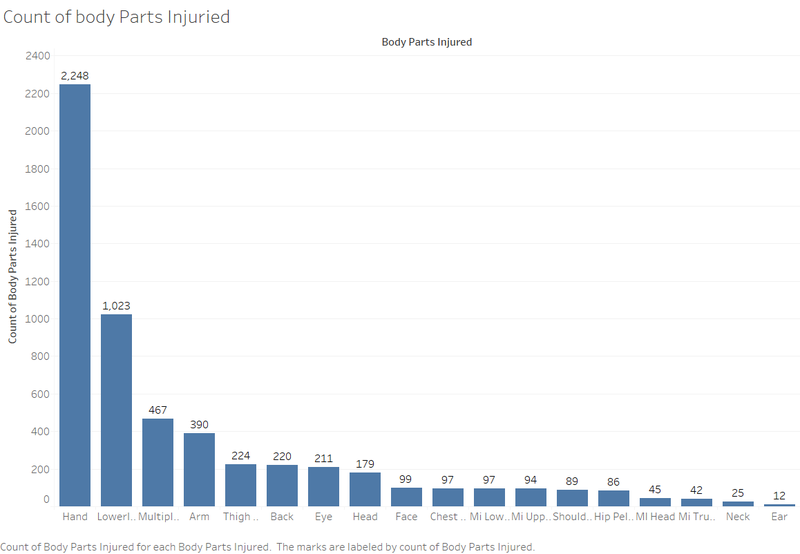
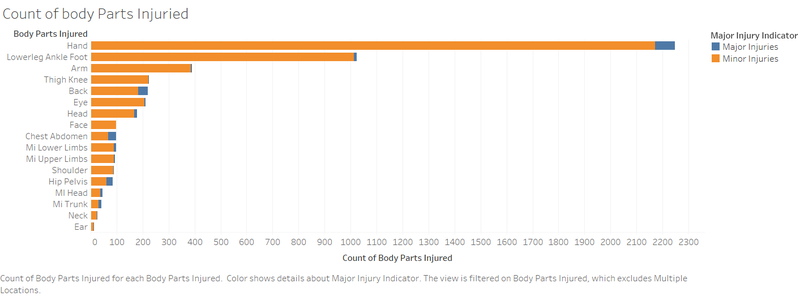
By answering the first part of the question, we are able to see if money should be spent on protecting a specific part of the body. It could be worthwhile if most of the workplace injuries occur in a few body parts. By plotting a bar graph, we are able to see the various injuries suffered. I would like to add that I have omitted “Multiple Locations” as the data does not tell us anything, and may interfere with the valid data.
However, by just answering the first part of the question, may not be sufficient in determining the body part which needs more attention. As such, the second part of the question is to determine if there are any body parts that would lead to a greater number of Major Injury. By plotting a stacked bar graph, we are able to compare the different injuries on the body parts and their corresponding severity.
From the first graph, it is able to tell us that the body part “Hand” and “Lower Leg Ankle Foot” are body parts that we must look into, since both of their values add up to more than 50% of all the workplace injuries. From the second graph, it is also able to tell us that we should also focus on the “Back” and “Chest Abdomen”. Although the back and chest abdomen has a low injury count, it has a high number of Major Injury, which may be beneficial to look into as well to reduce the overall workplace injuries.
Is an inverse correlation to workplace injury to experience?
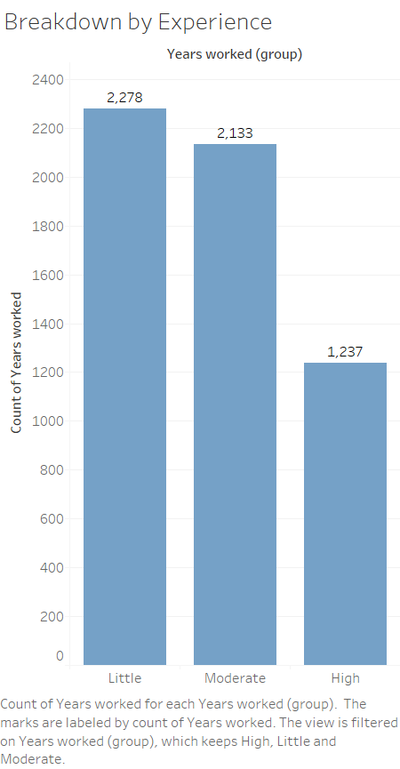
An inverse correlation is effective as it is able to show that workplace injuries are caused due to the lack of correlation. As such, if it is true, and an inverse correlation do exist, policies such as more workshops or greater supervision to inexperienced workers would be a solution to reduce workplace injuries. Since there are many varying years of experience, I have decided to group experience into 3 groups – Little Experience (<1 Year), Moderate Experience (1 - <5 Years) and High Experience (>5 Years).
By plotting this graph, we are able to see that those with little experience and moderate experiences results in most of the workplace injuries, with Little Experience resulting in a higher number of workplace injuries.
Is an inverse correlation to workplace injury to age?
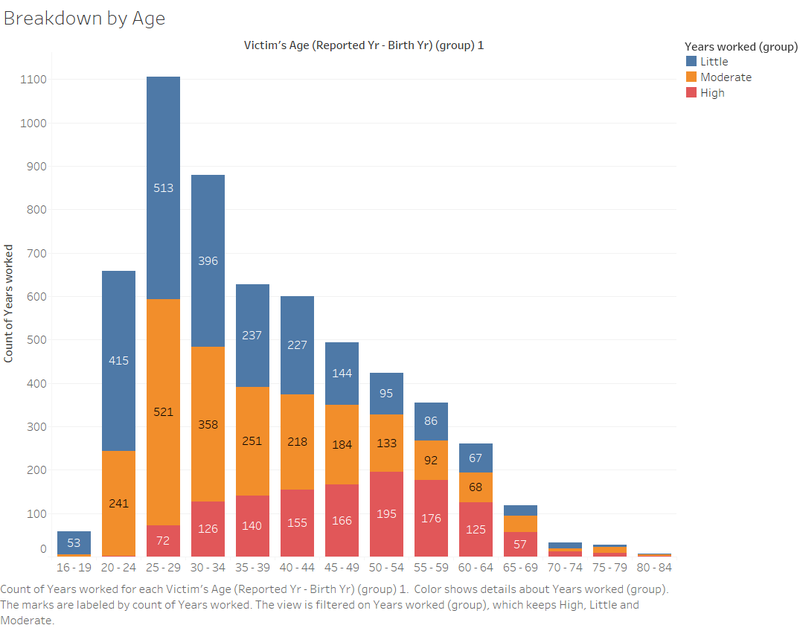
After I found out that there is an inverse correlation to workplace injury and experience, I wanted to determine if age also plays a factor. As such, I plotted a stacked bar graph to determine if there is an inverse correlation.
From this graph, we can determine that most workplace injuries are caused between the age group “25-29” and “30-34”. However, there is no accurate form of data in which it calculates the proportion of the work force between each of various age groups. It could be the case where there are more people working in the 25-29 such that the proportion of workplace injuries for another age group may be even greater.
Final Insights Gained
- The construction industry has the highest number of workplace injuries followed by Metalworking. This tells us that the Singapore Government should focus on both these industries, by proposing more mandatory safety policies and safety inspections. So that less injuries would occur in these industries. One insight that i gained is that most injuries that occurred in these 2 industries happened to the hand. Thus, i suggest using gloves or better protective gloves to reduce the possibility of injury.
- The hand and Lower Leg Ankle Foot are areas in which are most injured in the workplace injuries. For this insight we are able to derive from the visualisation that there is a higher relative number of injury, fall within people who are 20-29 Years old with 0 years of experience. (For hand injuries, it makes up 46.79% of all injuries to people with 0 years of experience, where the total average was around 40.74%.) I would suggest that there should be workshops or signs targeted at this characteristics, so that they would tend to be more careful.
- Although the number of workplace injuries for the Back and Chest Abdomen is low, there is high proportionate minor to major injuries.This insight tell us that we should focus on such areas as well, since a major injury would lead to less able working adults in Singapore's already strained workforce. One way to reduce the workplace injuries is to have posters or protection for these body parts.
- Workers with less than 1 year of experience are most prone to workplace injuries.In order to reduce the number of workplace injuries for these demographics, the government/compmanies may impose longer probation period and longer number of supervision. By having close supervision, the experts would be able to spot a mistake and stop it from causing any injury or workers would be more confident in their workplace. Resulting in lower workplace injuries.
- There is a high number of workplace injuries occurring to adults aged between 25-34.From this insight, it would be advisable to focus efforts to ensure that those people who faill within this age range are more vigilant and careful. This can be done by having putting posters to constantly remind them about safety.
DashBoard
Visualisation
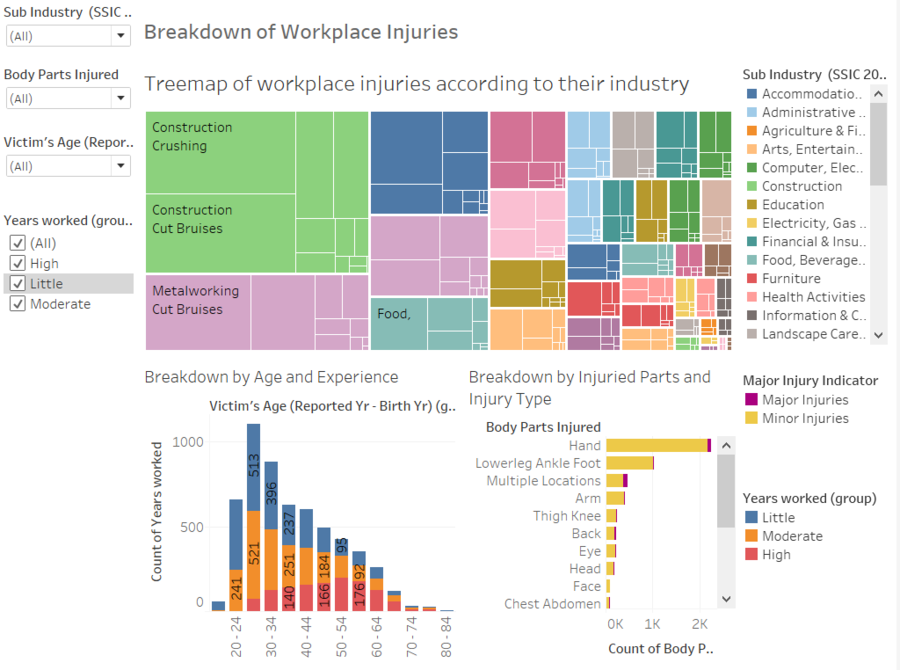
I have constructed a dashboard with the graph that i have constructed, such that it is much easier to visualize everything. You are able to see a walk-through via this YouTube link https://youtu.be/Wq5mZ7E5SIQ. Alternatively, the dashboard can be accessed via this link: https://public.tableau.com/profile/publish/IS428-MiniAssignment-TheBreakdownofWorkplaceInjuriesinSingapore2014/Dashboard1#!/publish-confirm
By creating this visualisation, i am able to have both an overview of all the injuries that occurred in the Singapore workplace in 2014 as well as a detailed breakdown of the which body part was affected the most, the age and the experience of each injury in order to gather insights that i can use to better focus efforts to areas where there are high number of injuries.
Tools Used
- Tableau 10.0
- Microsoft Excel (For Data Cleaning)
Acknowledgements
I would like to thank Aaron Mak Kang Sheng for teaching me some tricks in Tableau in order to improve my visualisation.

