IS428 2016-17 Term1 Assign2 Nguyen Luong Thanh Minh
Contents
Theme of interest
Jobs in Singapore are increasingly characterized by brain power rather than brawn. With an increasingly more educated workforce, many jobs are seeing their changes in activities as well as structure. The proportion of employees using computer for daily task has doubled over the last decade. It seems reasonable that such changes have resulted in fewer job injuries. This assignment aims to analyze the relationships between work injuries and other factors.
Questions for investigation
Is there a link between jobs and the number of injuries?
Is there a link between different jobs and the types of injuries?
Is there a link between age and gender and injuries?
Data gathering and cleaning
Before we analyze the relationships between different, we must first analyze the data set itself. Firstly, I would like to look into the distribution amongst the participants.
Gender
Age
Industries
From these charts, we can see that the data is not evenly distributed amongst the supposed participants. There are over 83% are male whole only nearly 17% are female. As such, further analysis based on gender is inaccurate. Regarding age, the data set follows a normal distribution with the majority of the participant falls within the range of 25 to 30 years old. Ideally, the data set should spread evenly throughout the working age range. Finally, regarding the investigated industries, the data set includes mainly the construction and manufacturing industries. Therefore, we can conclude that this data set is not evenly distributed and does not represent the entire workforce.
Exploration and Analysis
The first question I would like to attempt to answer is if there is a link between different jobs and the number of injuries. After some excel cleaning, I found out that there are 1455 different job titles in the data set. As such, analyzing based on this is not effective. Therefore, I would try to see if there is a link between different industries and work injuries.
From this graph, we can see that the majority of the work injuries come from the construction, manufacturing (specifically Metalworking) and Others such as Accommodations & Food Services, Wholesale & Retail Trade. Therefore, there’s definitely a link between different industries and the number of injuries. Labor intensive jobs in hazardous environment tend to have more injuries than others safer workplace such as Education and Entertainment.
However, I would like to further investigate on the percentage of manual work to conclude the aforementioned statement.
The above layered pie chart shows the relationship between different major industries and the percentage of manual work that is larger than 50%.
We can clearly see people with higher manual work tend to have more injuries. Therefore, this further affirms my statement that heavy labor jobs are more vulnerable to work injuries.
Secondly, I would like to explore the possibilities of the link between different industries and the injury types.
From these charts, we can see that different industries have different types of major injuries, depending on the job scope. However, the most common injuries are Cut and Stabbed as well as Struck by Moving objects and Slips and Trips. One of the interesting point I have noted is that Fall of Height is one of the most common types of injuries as well, and not limited to construction workers. Moreover, Collapse of Equipment seems to be another major type of injuries as well. Companies should ensure that their equipment does not fail to prevent such injuries from happening. The following sunburst chart also helps in identifying the major injury type according to the major industries.
Finally, I would like to explore the link between the geographic of the data set with its injuries.
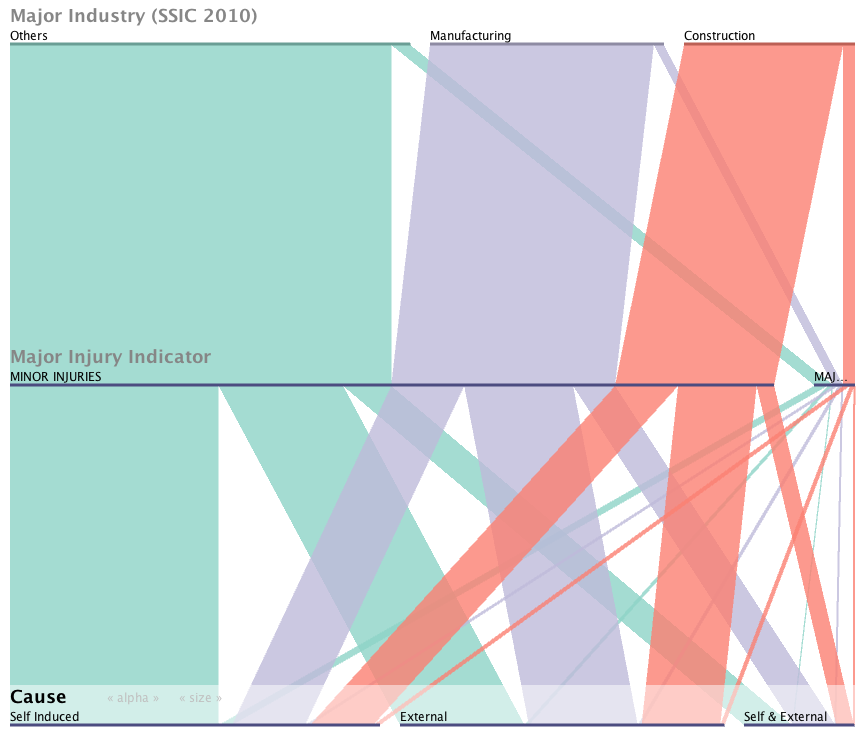
From this parallel sets chart, we can see that Construction has the highest percentage of Major Injuries. Moreover, a large portion of the injuries are caused by external factors. These factors can be due to hazardous working environment. Employers should ensure a safe working environment for their employees.
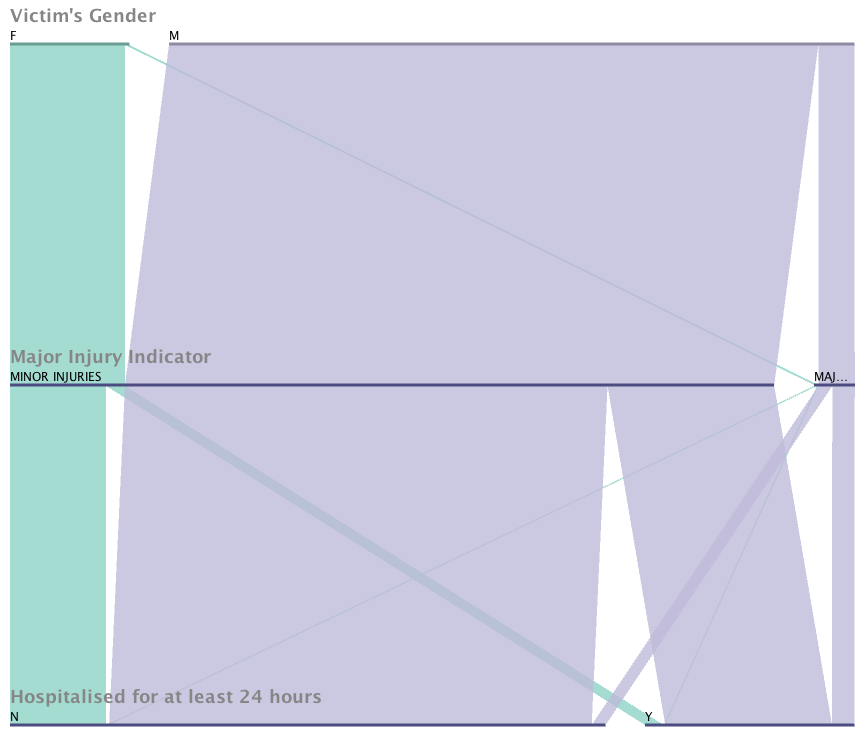
This chart shows that men are more likely to be majorly injured and hospitalized. Moreover, most people who are majorly injured are hospitalized.
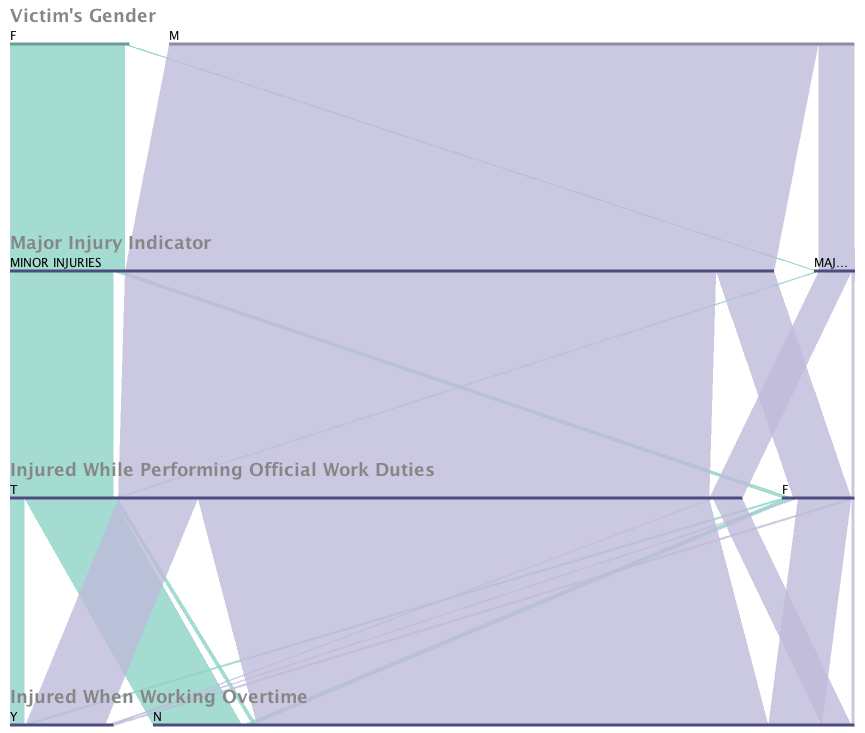
This parallel sets shows that most people are injured while performing official work duties, while men are more likely to be injured while working overtime.
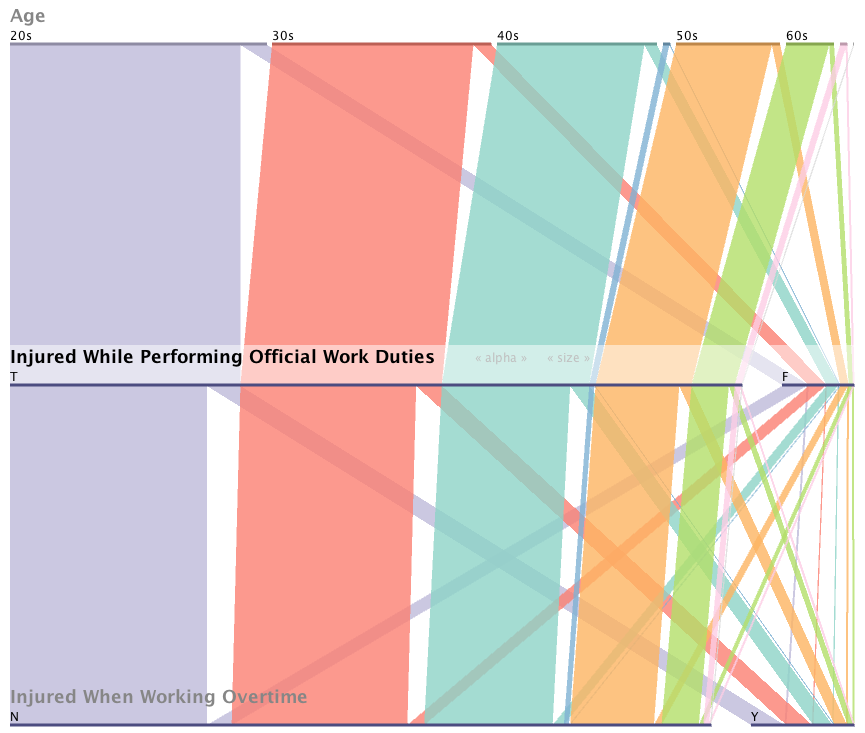
Regarding age, younger people tend to be injured more often. This might be due to inexperience in working conditions. Furthermore, as people get older, they tend to work overtime less and therefore are injured less.
Conclusion
Work injuries have strong correlation with factors such as industries, job scope, gender, age and other working conditions. Works that involve a high amount of manual labor tend to be more dangerous. While most of the injuries are caused by the workers’ carelessness, many of these injuries are caused by poor working condition and hazardous working environments. However, as people get more experienced with their jobs, injuries are lessened and less serious.


