IS428 2016-17 Term1 Assign2 Chua Feng Ru
Theme of Interest
The theme of interest for IDEAL assignment is to understand the accidents reported in the workplace of Singapore. It strives and aims to explore and analyse reported accidents in 4 general aspects:
- What is the distributions of Industry?
- What is the distributions of Injury?
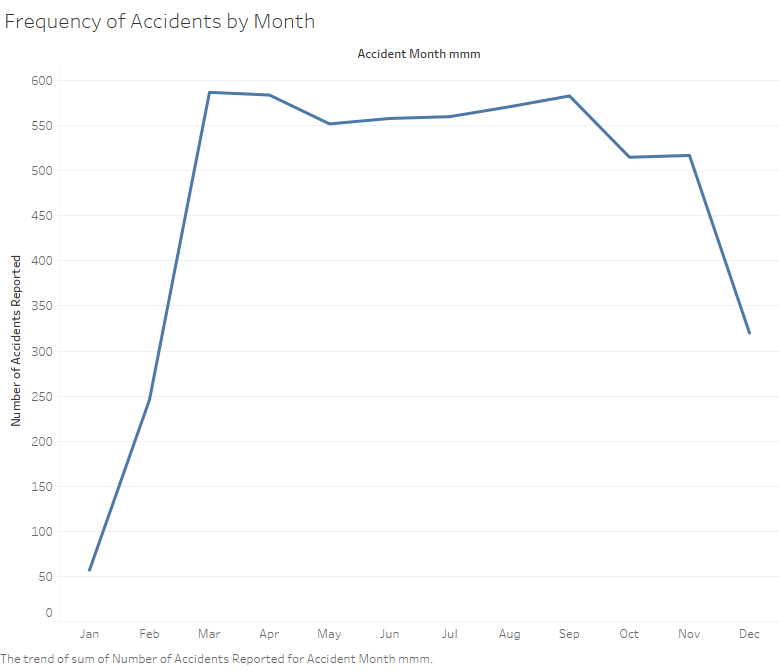
- What is the pattern of accidents happened across time?
- What is the relationship between variables?
Questions for Investigation
From the above questions, I am able to generate the specific questions:
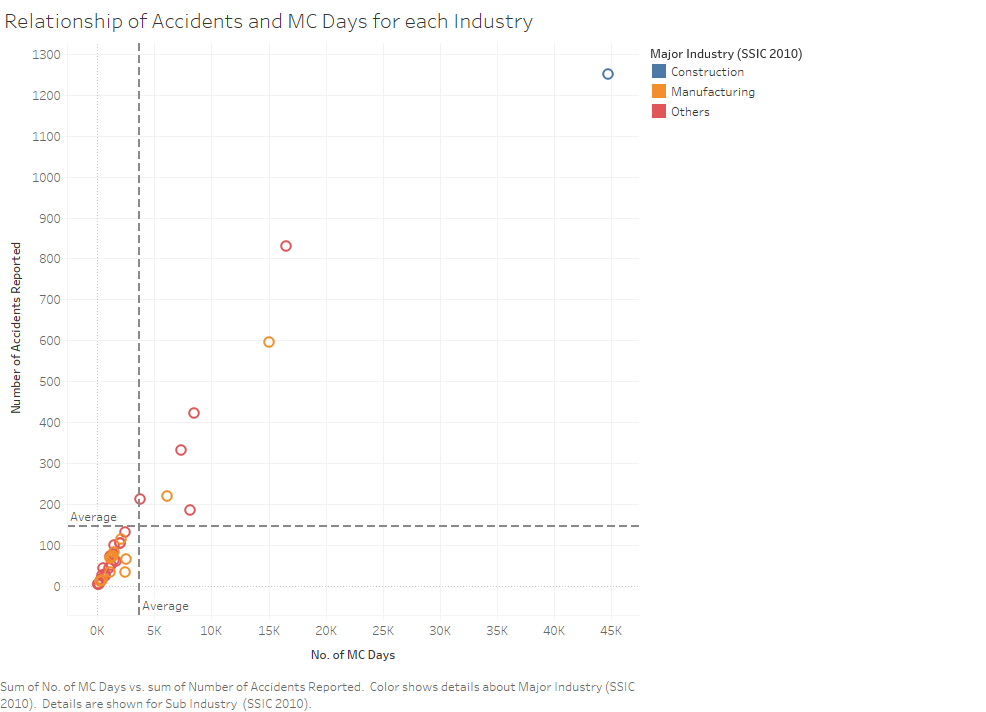
- What is the relationship between number of accidents reported and number of MC days, in terms of each major or sub-industry?
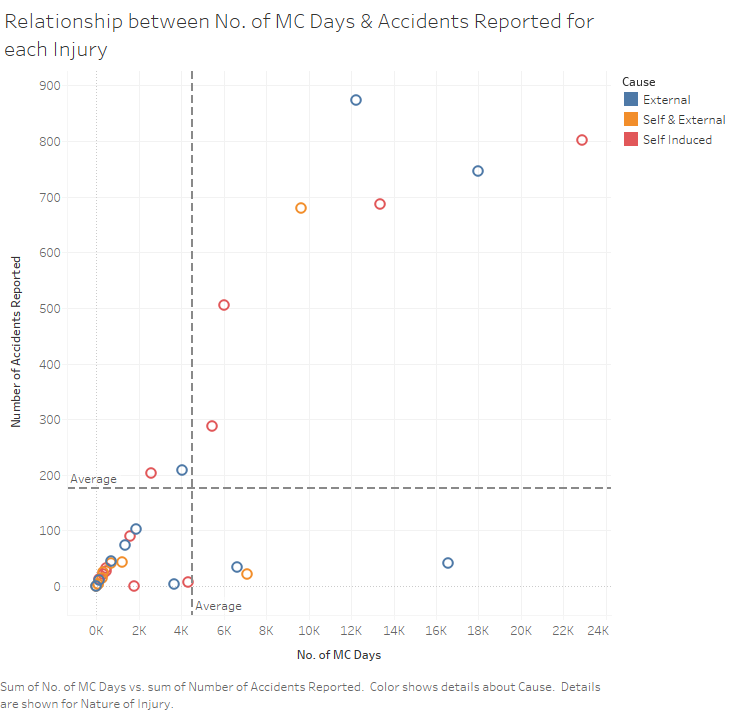
- What is the relationship between number of accidents reported and number of MC days, in terms of the nature of injury?
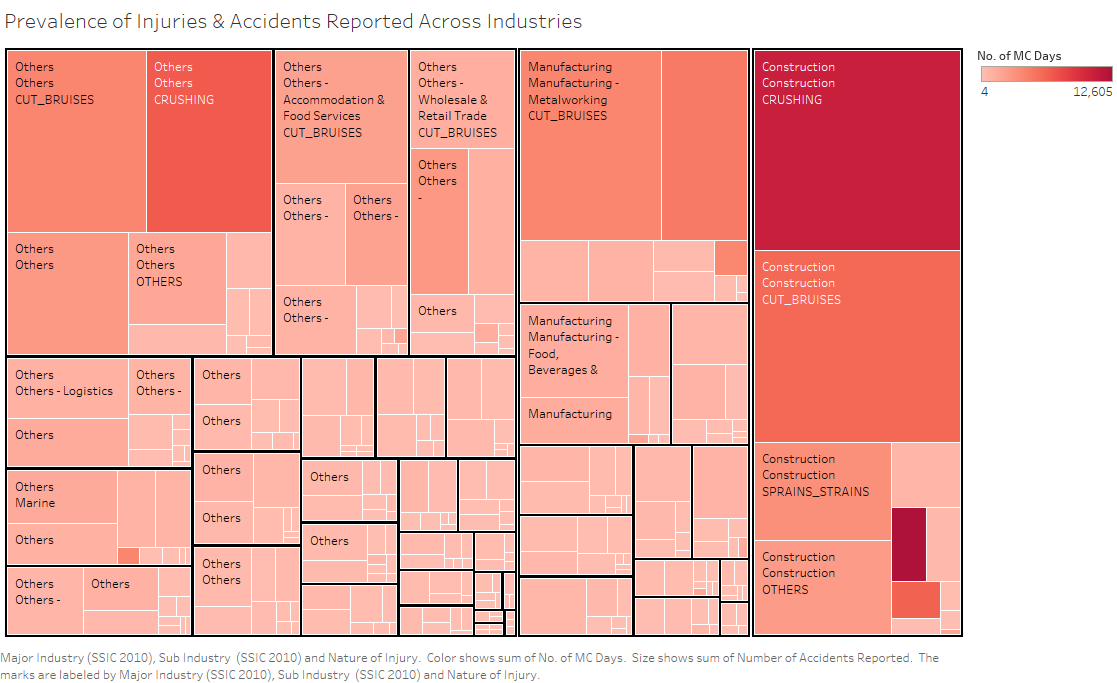
- What is the prevalence of injuries and accidents across industries?
- At which hour of a day is the accidents reported the highest or lowest?
- What contributes to the patterns of accident reported for each hour in a day?
- Does working experience minimizes the number of MC Days?
- Does the size of company affects the number of MC Days?
The link to the interactive visualisation is : https://10az.online.tableau.com/#/site/chuafengru/views/ChuaFengRu-MA2/UnderstandAccidentsinWorkplaceSingapore
IDEAL Process
From the initial question :
- What is the distributions of Industry?
- What is the distributions of Injury?
The 2 questions above made me plotted a graph which shows the distributions as below:
As I explored further, I realised that I am able to generate Scatter Plots of the both No. of MC Days and No. of Accidents Reported.
This allows me to find out what is the relationship between No. of Accidents Reported and No. of MC Days for each industry and injury,
and thus also evolve the question into:
- What is the relationship between number of accidents reported and number of MC days, in terms of each major or sub-industry?
- What is the relationship between number of accidents reported and number of MC days, in terms of the nature of injury?
From the graphs above, I am able to understand which industry is highly correlated in both variables in terms of industry and nature of injury.
This allows me to understand as well, which industry and injury is affecting safety of workplace. For example, I will be able
to focus on those data points towards the diagonal upwards towards the right, as these are the industries or injuries where there are above average Accidents Reported
and No. of MC Days.
Through the scatter plots, I realised that an addition of the question "What is the prevalence of injuries and accidents across industries?" would be good to provide a full picture on
the relevant variables.
Through the treemap, I am able to understand from a bigger picture, the prevalence (in terms of number of records and MC Days) of the incidents for each sub-industry. The color signifies the severity of
the accident in terms of total MC Days, while the size of each box signifies the number of accidents reported.
From the treemap, I am able to determine that Crushing in Construction is the most prevalent, as it has the biggest box and the deepest color shade. While in Manufacturing, Cut Bruises in MetalWorking is the most prevalent.
Lastly, in Others, Crushing and Cut Bruises are the most prevalent.
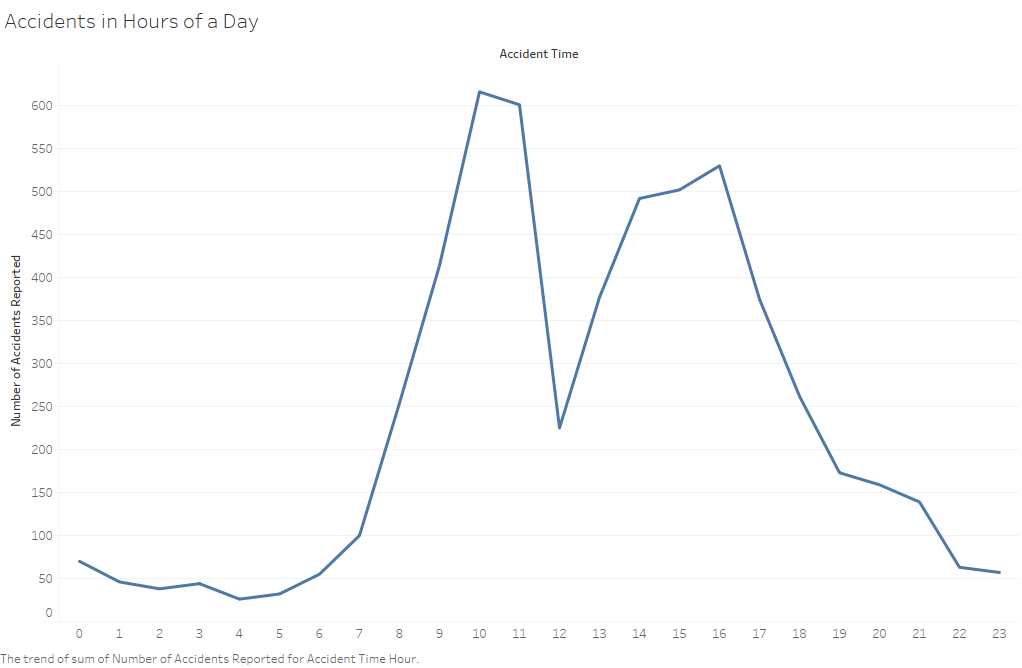
In this phase of investigation, I proceed on to answer the "What is the pattern of accidents happened across time?" question. Initially, I plotted a time-series graph across the months in 2014,
however I realised that using a finer grain of dimension such as "Hour" offers a more sensitive view in terms of changes in accidents-reported.
Thus, I drilled down further to look at the Accident Time in terms of Hour of a day, and this prompted me to change the question to:
- At which hour of a day is the accidents reported the highest or lowest?
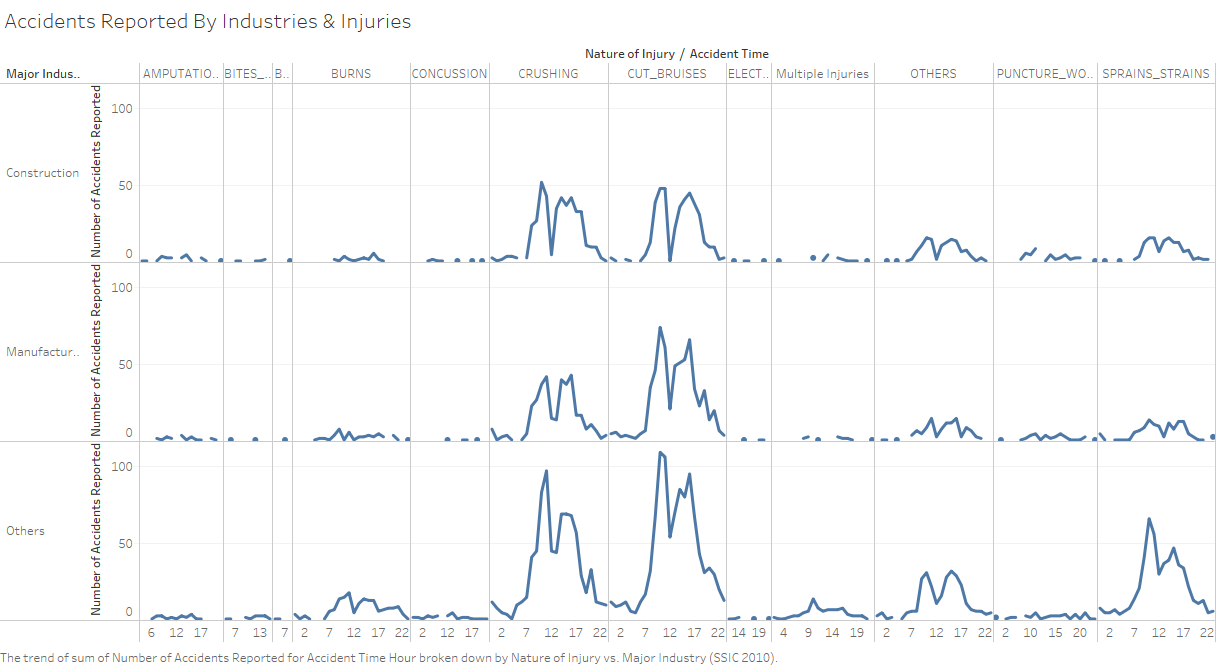
- What contributes to the patterns of accident reported for each hour in a day?
The first graph allow me scan through the general trend of accidents happening in a specific hour of a day. And, through the interactive visualsation, the trellis plot in the second graph will reflect
what contributes to the rise and fall of the general trends. As from the interactive visualisations, I can conclude that the rise in overall accidents reported from 10-11AM and 2-4PM can be attributed to
Crushing, Cut & Bruises in all 3 major industry, Sprain & Strains from the Other industry, and Other injury from Other industry.
This part of the investigations arise from my personal beliefs...
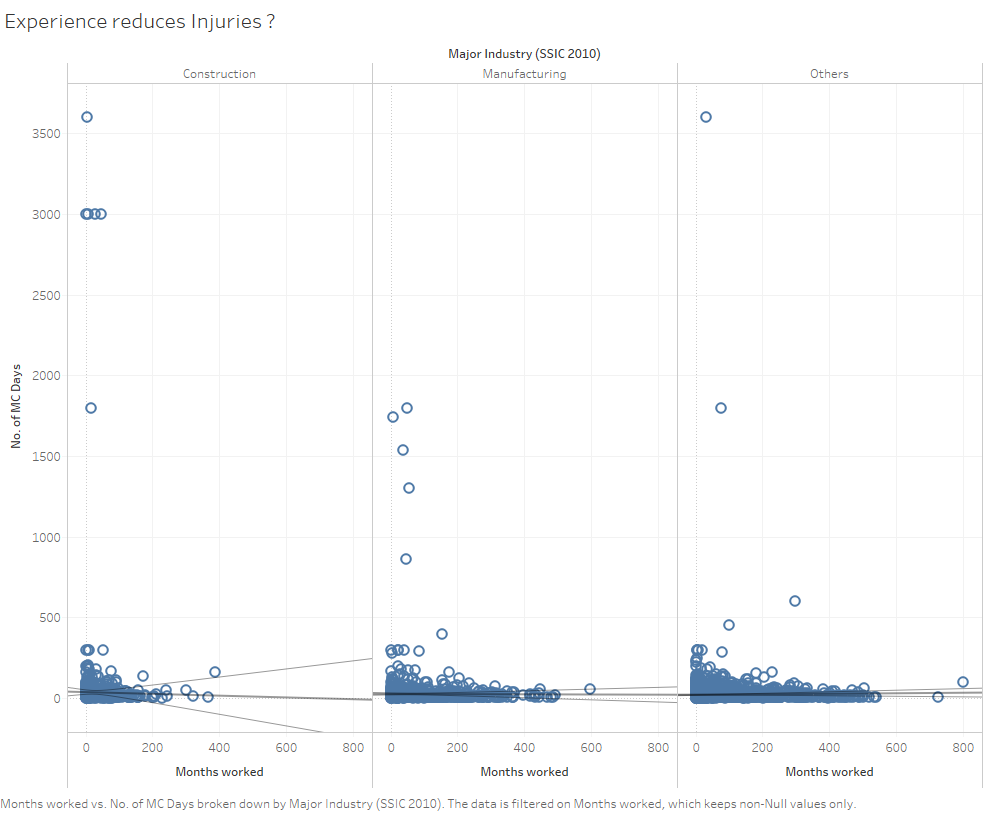
As from my belief that the more experience you are, the less likely you are to be badly hurt. And in this case, the degree of hurt or injured is being measured by the No. of MC Days.
With this, I proceed with the plotting of visualisations to answer "Does working experience minimizes the number of MC Days".
Contrary to my belief that experienced workers will result in lesser injury, the coefficient of determination (R-Square) value shows that there is simply no correlation between experience and MC Days.
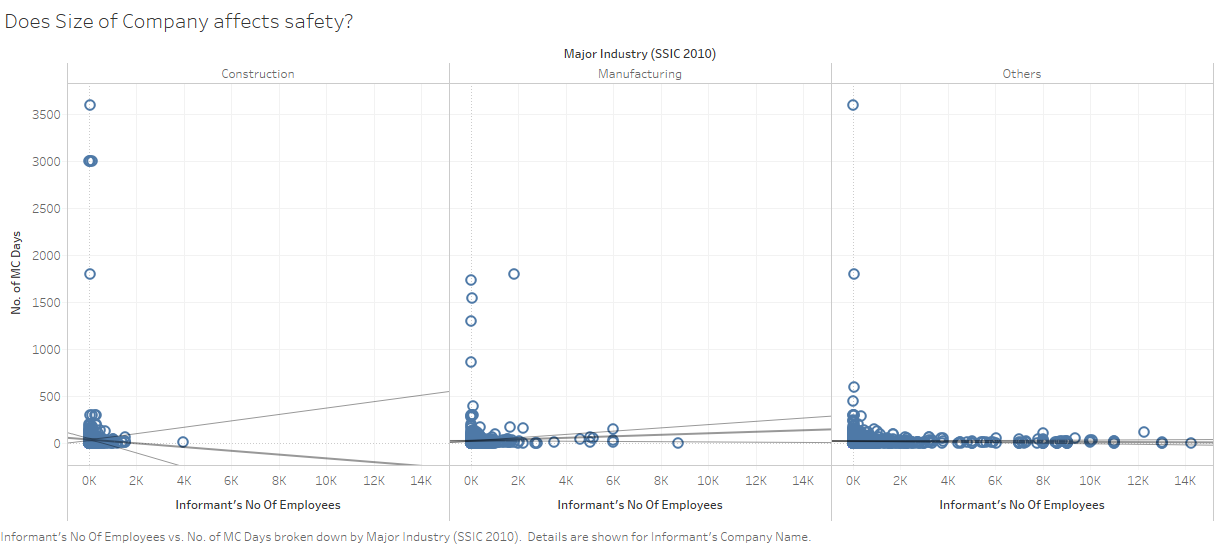
My other belief was that if the company has a large number of employees, it would also meant that it would be more difficult to regulate safety. This prompted the question of "Does the size of company affects the number of MC Days?".
From this question, I proceed to plot No. of MC Days by Informant No. of Employees, where each data point is the Informant Company Name.
This result actually shows that there is no correlation between No. of MC Days and Informant No. of Employees. The R-Square value shows as close to 0% across all major industries.
Tools Utilized
- Excel 2013 for data preparation
- Tableau for visualization


