IS428 2016-17 Term1 Assign2 Audrey Jee Zhi Ying
Abstract
In 2015, the Ministry of Manpower amended the Work Injury Compensation Act to increase the maximum amount of compensation for workplace-related injuries by approximately 20%. From 1 January 2015 onwards, employer will be liable for $69,000 to $204,000 in the event of a workplace death. If a worker suffers total permanent incapacity, compensation may range around $88,000 and $262,000. Cap on medical expenses has also increased from $30,000 to $36,000. From a cost perspective, workplace-related injuries are becoming more and more costly for a business in Singapore. Not only in terms of direct medical expense, but also cost items linked to staff turnover, training of replacement workers, loss of worker output, insurance premium and legal fees. Hence, through this assignment I would like to identify some relationships between the type of workplace injuries, the industry, age of employee etc.
Problem and Motivation
Medical leaves by employees are costly to a business, hence I would also like to find out if there are any links between the no. of days of MC and the type of injury. Going one step further, find out the relationship between such injuries and when they are prone to take place by answering questions such as are there any links between hour of the day and the no. of injury? Are there any links between month of year and the no. of injury?
Findings
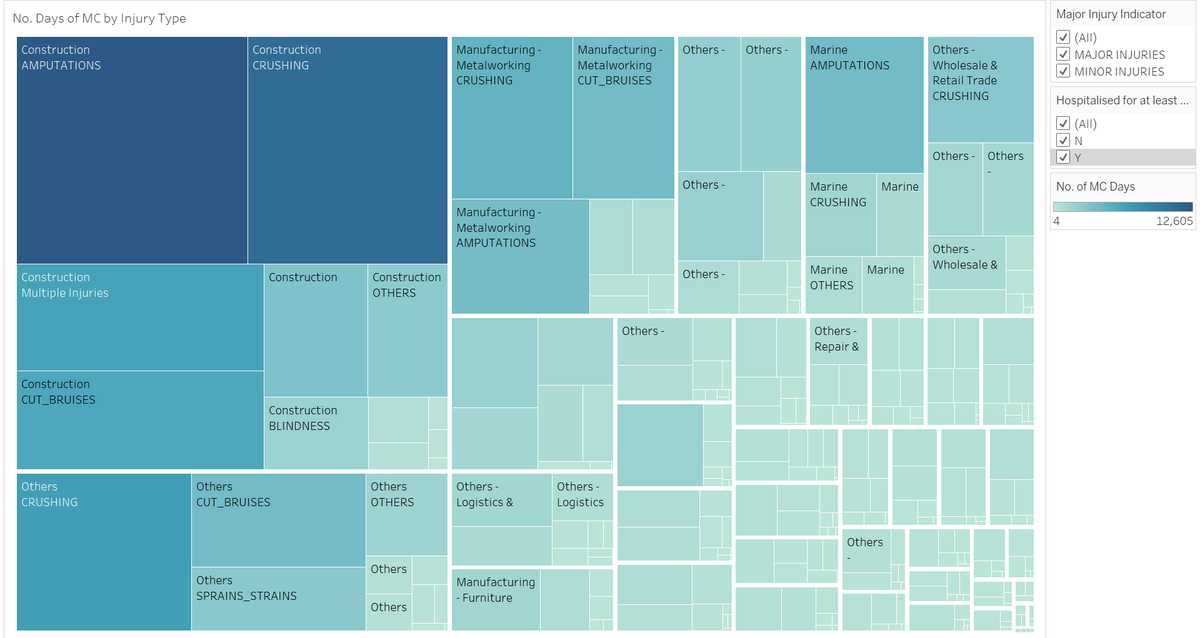
From the intensity of the boxes shaded in the tree map, we can see that Amputations within the construction industry is one of the more common workplace injury that cost businesses the most number for medical leaves, followed by construction crushing.
Next, I moved on the explore the relationship between timing of the day versus the occurrence of each of these work injuries.
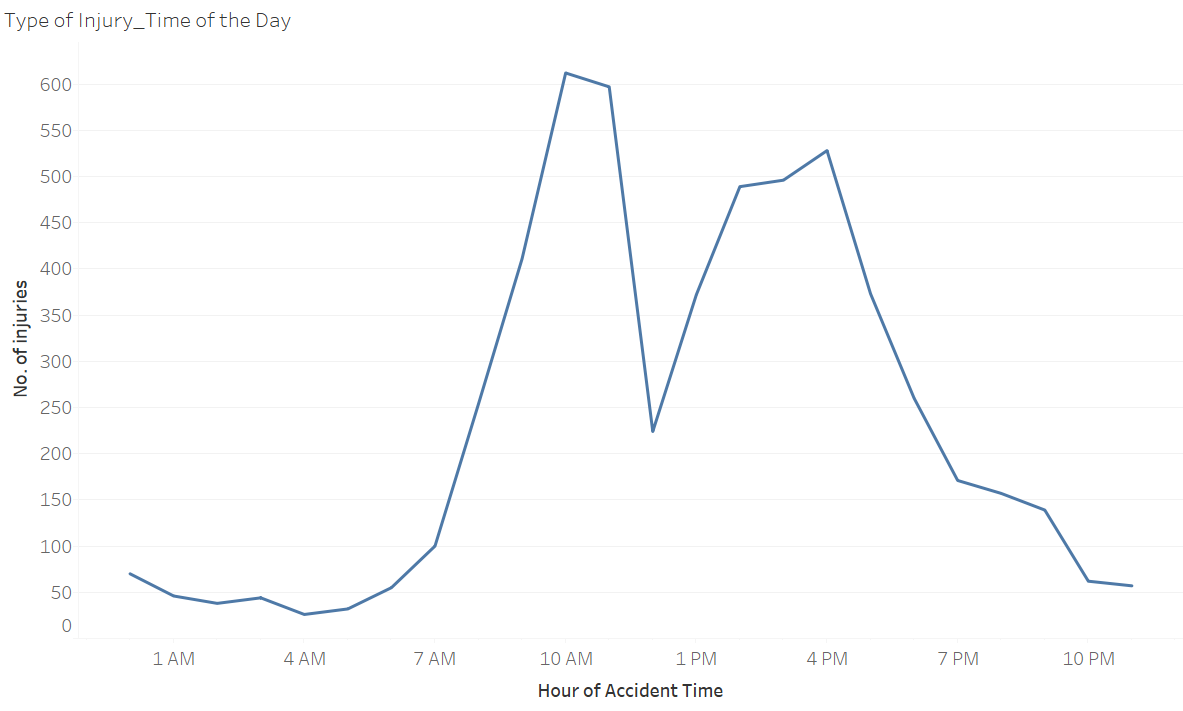
Overall, for all workplace injuries we can observe that work injuries tend to spike at 10am and 2pm to 4pm. This accident prone timings should be something site managers or company personnel to take note of.
Moving one step further, I drew a link between the type of “costly” injuries versus the time of the day where they are prone to occur. This dashboard could be useful to help managers the a various industry grasp a better understanding of the time of the day where such accident occurs and look into ways to mitigate or minimize such occurrences.
Dashboard can be found here: https://public.tableau.com/views/WorkPlaceInjury/TimeofDayVSInjuryType?:embed=y&:display_count=yes
Tools Utilized
Tableau 10.0

