Theme of Interest
Regardless of the organisation or industry, having a safe work environment is very important. Any injury could cause a major issue to the victim’s family, co-workers or the organisation itself. Other than the mental and physical suffering, the financial burden could be placed on other family members. For the organisation, having a safe environment would lessen unnecessary costs. If an employee is injured, the organisation’s productivity will decline. Other co-workers' workload will increase to cover for the victim. Safety also improves the quality of work produced as employees would be focusing on their work than their safety. Therefore, the following analysis would be to find out the factors that contribute to workplace injuries by using the dataset provided, Workplace Injuries Data 2014. So that related organisations or industries could keep in mind to reduce the number of workplace injuries occurred.
Questions for Investigation
- How did the workers get injured?
- Where did the workers get injured at?
- What are the injuries?
- What is the profile of the worker?
- When did the workers get injured?
Tools Utilized
The following tools were utilized during the analysis:
- Microsoft Excel 2016
- JMP Pro 12 – Data preparation
- Tableau 10.0 – Create visualizations and interactive dashboards, and publish final visualization online
Data Attributes Used
- Accident Agency Level 1 Desc
- Accident Agency Level 2 Desc
- Accident Day
- Accident Time
- Accident Type level 2 Category
- Accident Type Level 2 Desc
- Accident Weekday
- Body Parts Injured
- Cause
- Injured When Working Overtime
- Injured While Performing Official Work Duties
- Major Industry (SSIC 2010)
- Major Injury Indicator
- Months worked
- Nature of Injury
- Occupation
- Pct Manual Work
- Sub Industry (SSIC 2010)
- Supposed Start Work Timing on Day Injured
- Victim's Age (Reported Yr - Birth Yr)
- Victim's Employment Start Date
- Victim's Gender
Data Preparation
Step 1. Remove unnecessary data attributes
Step 2. Check through missing data patterns
|
|
There is a total of 33 rows that have some missing data. The data attributes that have missing data are Supposed Start Work Timing on Day Injured, Victim's Employment Start Date and Months Worked. As the missing data is relatively small, I had chosen to ignore them.
|
Step 3. Transform text formats
|
|
For the three attributes, Body Parts Injured, Nature of Injury and Major Injury Indicator, some of the data have uppercasing, some lowercasing and some used underscores as spaces. To make the data standardised for nicer representation, there is a need to transform those values.
|
|
|
For Major Injury Indicator, I have created a new column and used the formula as shown on the left. The formula is to change the values to title case.
|
|
|
For Body Parts Injured and Nature of Injury, I have created new columns and used the formula as shown on the left. The formula is to change the values to title case and replace underscores with spaces.
|
Step 4. Remove unnecessary words
|
|
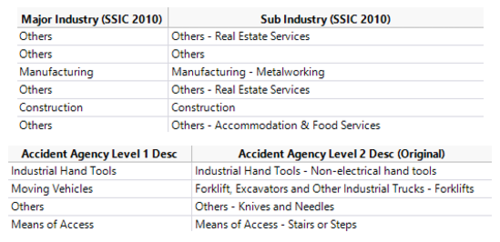
For the two attributes, Sub Industry (SSIC 2010) and Accident Agency Level 2 Desc, they both contain values of their above hierarchy which are Major Industry (SSIC 2010) and Accident Agency Level 1 Desc respectively. To reduce the repeated words and for better representation, some transformation will be done.
|
|
|
For Sub Industry (SSIC 2010), I have created a new column and used the formula as shown on the left. The formula will first check if it contains a hyphen. This is because not all of the data have the repeated words of the Major Industry (SSIC 2010) attribute. If it contains a hyphen, it will then remove the words and the hyphen of Major Industry (SSIC 2010) in the Sub Industry (SSIC 2010).
|
|
|
For Accident Agency Level 2 Desc, I have created a new column and used the formula as shown on the left. The formula will first check if it contains the values in Accident Agency Level 1 Desc and then, remove the repeated words and hyphen. This is because not all of the data follows the same format whereby the Accident Agency Level 1 Desc attribute is in front of the Accident Agency Level 2 Desc. An example will be the “Moving Vehicles” as shown in the first image.
|
Step 5. Recode occupation attribute
|
|
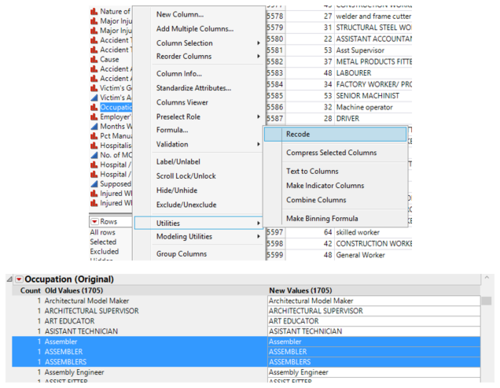
For the Occupation attribute, some occupations have different formats, spelling errors or in plural forms. However, they all are related to the same occupation. An example is shown the left. To clean up this attribute, I used the recode function in JMP.
Reference: Using Recode in JMP for data preparation – http://blogs.sas.com/content/jmp/2016/07/27/19692/
|
|
|
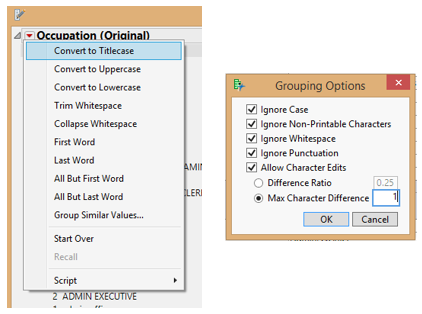
Firstly, I used the “Convert to Titlecase”, “Trim Whitespace” and “Collapse Whitespace” functions. “Collapse Whitespace” is to replace two spaces with one. Then, I used “Group Similar Values” function and change the “Max Character Difference” to 1. This is to group the occupations that are in plural forms.
|
|
|
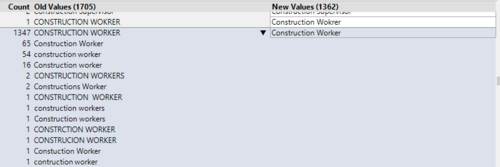
The example on the left shows the result of what I have done in the previous step. However, it can be seen there is still a value that has yet to be grouped together. I briefly check the values and manually group the occupations if there is a need. Then, I save it as a formula column.
|
Step 6. Transform time formats
|
|
When exporting over to Tableau for visualisation, the attributes, Accident Time and Supposed Start Work Timing on Day Injured, are not in the format that Tableau required.
|
|
|
To represent properly, I did a quick fix by first changing the attributes’ data type to “character” and then, using the formula on the left. After exporting to Tableau, I change the data type to Date & Time.
|
Step 7. Setting up Hierarchy
|
|
In Tableau, I set up some hierarchy that I know from the start. This is to make it easier to use the attributes for visualisation.
|
Visualisation Process
In general, based on the general questions stated at the start of this documentation, I used the relevant attributes and construct the visualizations accordingly.
How did the workers get injured?
|
|
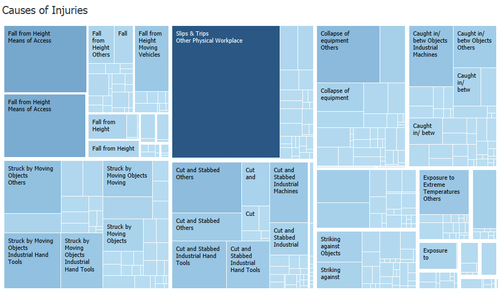
Using the Accident Type and Accident Agency hierarchy and cause attribute, I plotted a treemap to show the causes of injuries. I used the sum of the number of injuries as the size and the % of total number of injuries as the color.
|
Where did the workers get injured at? What are the injuries?
|
|
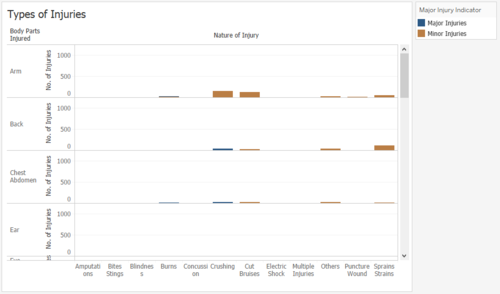
Here is a screenshot of the types of injuries occurred. Using the attributes, Body Parts Injured, Nature of Injury and Major Injury Indicator, I tried using a bar chart to show the distribution. However, I realised it is quite difficult to analyse the chart as the size of the bar cannot be seen.
|
|
|
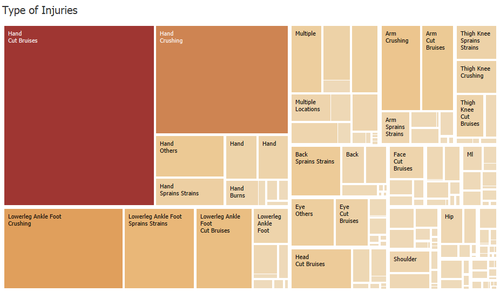
By using a treemap, I was able to see the distribution much clearer. I also used the same setup as the previous treemap, which is the sum of the number of injuries as the size and the % of total number of injuries as the color.
|
What is the profile of the worker?
|
|
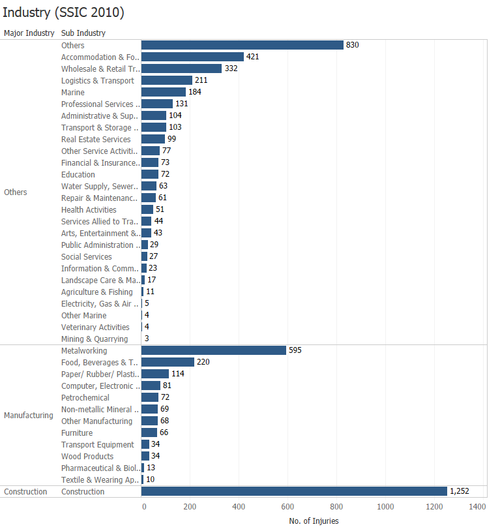
Using the Industry hierarchy and sorting the number of injuries by ascending order, I used a bar chart to clearly show the top few sub-industries that are more prone to workplace injuries such as construction.
|
|
|
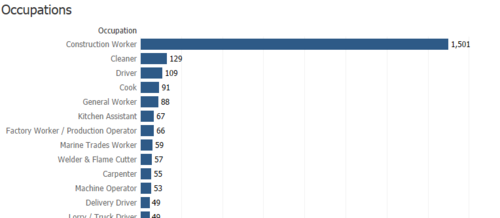
Here is a screenshot of the occupations, as it is a relatively long list. Using a bar chart and sorting the number of injuries by ascending order, it can be seen that construction workers are the top occupation that is prone to workplace injuries.
|
|
|
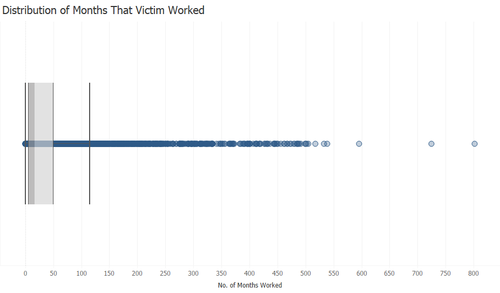
I used a boxplot to show the distribution of months worked by a victim at the time of the accident and it can be seen that it very right-skewed.
|
|
|
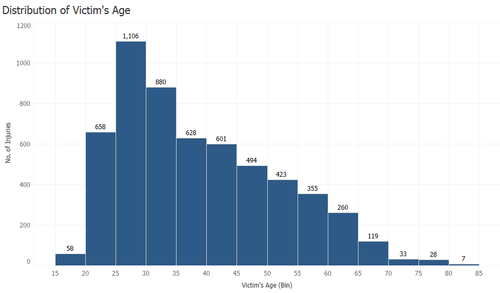
Using a histogram to show the distribution of the age, it can be seen that young adults, aged 25 to 30, are more prone to workplace injuries. The bin was changed to 5 to make it easier to analyse the chart.
|
|
|
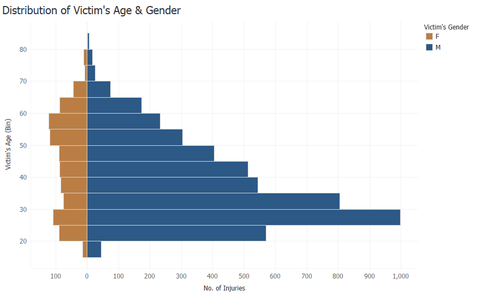
After creating the histogram, I wanted to try to create a simple divergent bar chart using the attributes, age and gender, to show its distribution. It can be seen that majority of injuries come from males.
Reference: https://community.tableau.com/thread/208290.
|
When did the workers get injured?
|
|
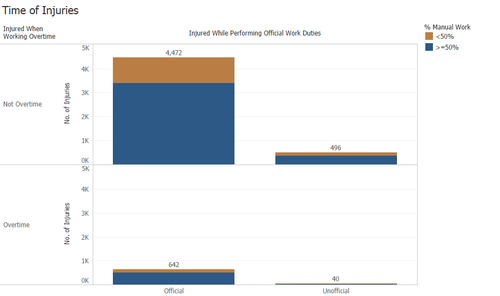
Using a bar chart, I wanted to find out if there is any pattern between the three attributes, Injured When Working Overtime, Injured While Performing Official Work Duties and Pct Manual Work. It can be seen that majority of the injuries come from performing official work duties that are more than 50% manual work and it occurs during working hours.
|
|
|
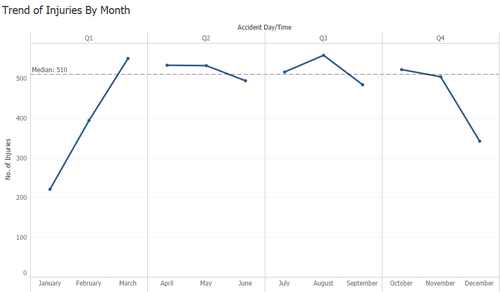
Using a time-series chart, it can be seen that there is an increase in the number of injuries in the first quarter and a decrease in the last quarter.
|
|
|
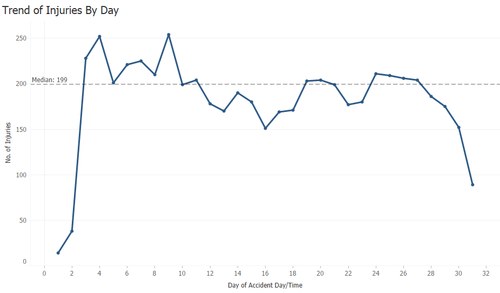
Using a time-series chart, it can be seen that the first and last few days have lesser injuries.
|
|
|
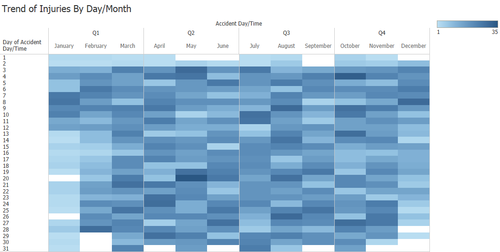
I tried using a heatmap to see if there are any patterns between the month and day of the accident. However, it can be seen that there are hardly any distinct patterns from the chart.
|
|
|
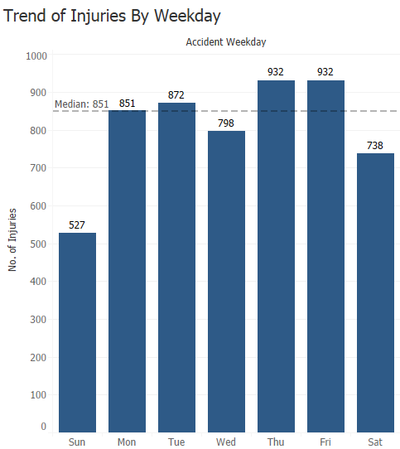
Using a bar chart, it can be seen that there is hardly any distinct pattern, other than for Sunday, the number of injuries is the relatively lower than the rest. This is because Sunday is usually a non-working day for most organisations or industries.
|
|
|
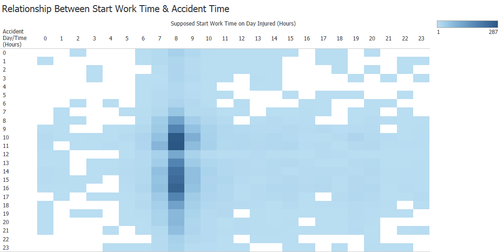
I wanted to find out if there is any relationship between the start work time and the accident time. Before I could do so, I created a custom date with the setup as shown on the left.
|
|
|
Using the two new attributes created, it can be seen clearly that most of the injuries that happened have a start work time of 8am and the accident time’s range from 9am to 6pm. This also proves the previous point made that the majority of injuries occurred during working hours.
|
Final Visualisation
Final Visualisation Link: https://public.tableau.com/profile/lim.ting.zhi#!/vizhome/LimTingZhi-VAAssignment2/FinalVisualisation
The main question stated at the start of this documentation is to find out the factors that contribute to workplace injuries. Thus, the final visualisation consists of two tabs, Victim Profile and Injury Period. First, for Victim Profile, the dashboard shows an example of an occupation, cook. The factors that are highly contributing to workplace injuries would be the occupation, industry and age. This will also determine the cause and type of injuries occurred. The number of months worked is not a significant factor as no matter how experienced the worker, he/she is still relatively prone to injuries. The gender is also not quite a significant factor as it could be due to the victim’s occupation. For example, the top few occupations are mainly male dominant. Second, for Injury Period, the dashboard shows the period of injuries occurred as a whole. From the overview, the time factors are not significant factors. This is because accidents will still occur, regardless of the time period and there are not many distinct patterns can be seen.

