IS428 2016-17 Term1 Assign2 Aaron Mak Kang Sheng
How to stay safe at work
I wanted to see if there are any main factors that cause employees to be injured. So I first started exploring certain factors such as months worked, gender, industry, day of the week, time of the day, the age of victim or weather.
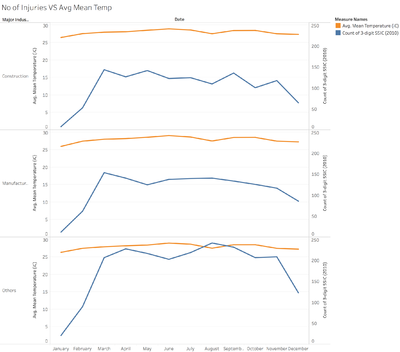
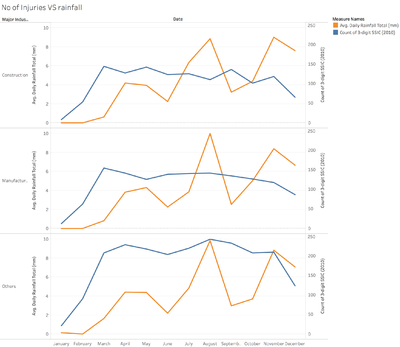
My initial hypothesis for weather was that the temperature fluctuations or rainfall affect the frequency of injuries in certain industries. The initial data set does not consist of weather so I had to gather data from http://www.weather.gov.sg/climate-historical-daily/. To prepare the data, I had to create a new column called date and export the table to a new one. After linking both tables from 2 datasets using the LEFT JOIN function, I’m able to construct a graph.
There’s no clear trend that weather affects it in general. Even after exploring into greater detail by filtering by industries or going to specific days rather than months, there is no correlation at all. So I’ve decided that this hypothesis is proven false and moved on.
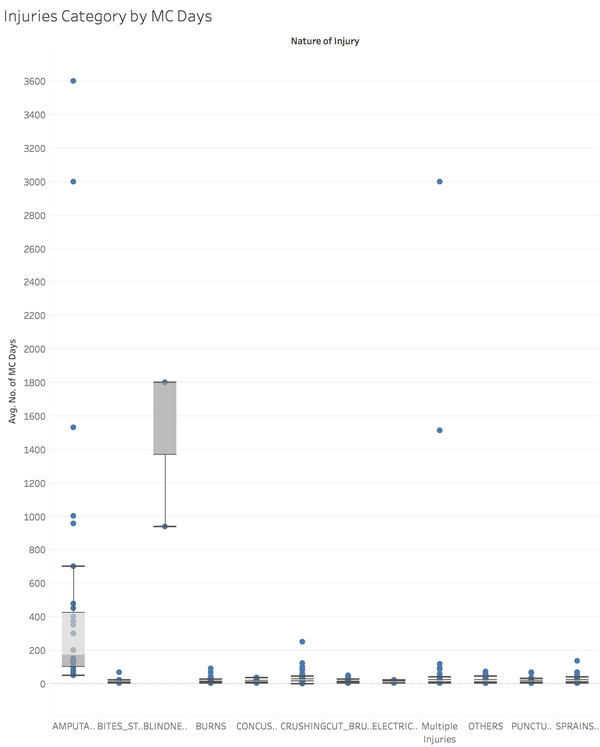
I’ve wondered if there’s a relationship between the nature of injuries and the MC Days. I assume that the number of MC days are related to the seriousness of the injury.
True enough, some nature of injuries are much more serious than others. I then wondered if they could be split further into more industries.
I wanted to find out if a particular industry has more of a certain nature of the injury and the seriousness of it (which I assume is related to the number of MC days) so I investigated this further in the next few graphs.


