IS428 2016-17 Term1 Assign2 Tee Yu Xuan
Contents
Theme of Interest
The theme selected in this project is regarding the workplace injuries happening in Singapore. The data being used is provided by Workplace Safety and Health Institute (WHS) for the Year of 2014.
Problem and Motivation
Safety has always been a huge concern for everyone, with the media focusing its attention on health issues such as viruses (Zika etc.) and even terrorist attacks, we often forget about the safety of the place we spend the most time at (other than our homes), the workplace.
Are the safety measures put in place by employers sufficient in preventing such incidents? What are the most common workplace incidents in Singapore? How can we minimize to our best ability the workplace hazards that might cause safety issues? This project aims to answer some of these questions with the workplace injuries reported 2014 and provide some insights on the workplace safety conditions in Singapore.
Questions for Investigation
- Which are the industries with the highest number of workplace injuries? Is the industry with the highest injury, also the one with the highest major injuries?
- Which are the occupations with the highest number of workplace injuries?
- Which body parts are most commonly injured?
- Is there any relation between the body part injured and the industry? (Food&Beverage = more injuries to hands?)
- Are the injuries self inflicted or through external causes?
- Is there any relationship between working overtime and the injuries?
- Is there any relationship between amount of manual work in the job and the injuries? (higher % of manual work, higher risk?)
- Is there any relationship between accident categories and industry/occupation?
Investigation
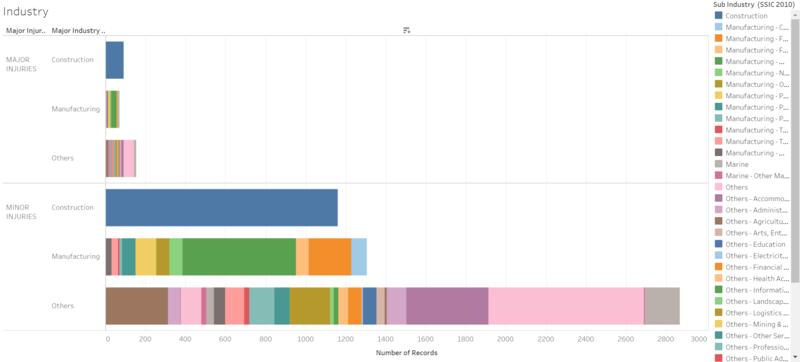
- Which are the industries with the highest number of workplace injuries? Is the industry with the highest injury, also the one with the highest major injuries?
As the visualization for the above question was constructed, Industries was first separated by their major industries, which are Construction, Manufacturing and Others. However this was not a good representation of the industry as it was too generic. To achieve more indicative results, the chart was colored by the sub-industries within the major industry. This allows the user to identify more specifically the number of injuries in each sub-category.
The table shows that the manufacturing industry has the highest number of injuries (regardless of minor/major) but construction industry has a much higher number of major injuries. Further visualizations in later parts of this report will look further into it.
The usage of tableau also allows us to highlight areas of interest, for example, identifying
Tools Utilized
- Google Search Engine
- Tableau
- Filters and Excel functions that aids data cleaning
Inforgraphics
Conclusion/Results
Comments
References
<references>
