IS428 2016-17 Term1 Assign1 Li Weiqiao
Abstract
Problem and Motivation
Contents
Abstract
This project aims to analyze the housing market in Singapore. With special cooling measures and TDSR framework, supply and demand of private poverty are slightly changing now. Through data visualization, we can clearly see the trend happening in private poverty market. Some policy recommendations might be helpful to attract investment and keep housing market thriving.
Problem and Motivation
Singapore property market has been slackening since 2013, tempered by the government initiated cooling measures and a series "tax" fee. In the meantime, government did not stop to supply the poverty market which results in the over-supply problem in the poverty market.
Additional Buyer's Stamp Duty makes foreign investment bored and uninterested which lost of foreign capital intake. The Total Debt Servicing Ratio is reaching multiple-home owners by requisitions.
Flooding cooling measures control the inflammation rate in the property market but freeze the Singapore housing market for a long time.
The analysis will identify:
- Growth of available private property supply
- Trend of price and rental change from 2000 to 2015
- Trend of vacancy rate
This analysis aims to point out the key problem in the housing market now and initiate effective measures.
Approaches
I collected relating data from The Urban Redevelopment Authority (URA) REALIS database. Since this analysis focuses on the private poverty effect, I zoomed in the residential property information. Relative data from the database was examined and visualized using Tableau and some trends are obvious to stand out. Combined with the current government policies and society situation, I drew conclusions on the private property market and recommended measures that government could consider to take.
Visualisation of Graph
Available and Completed Private Property Units

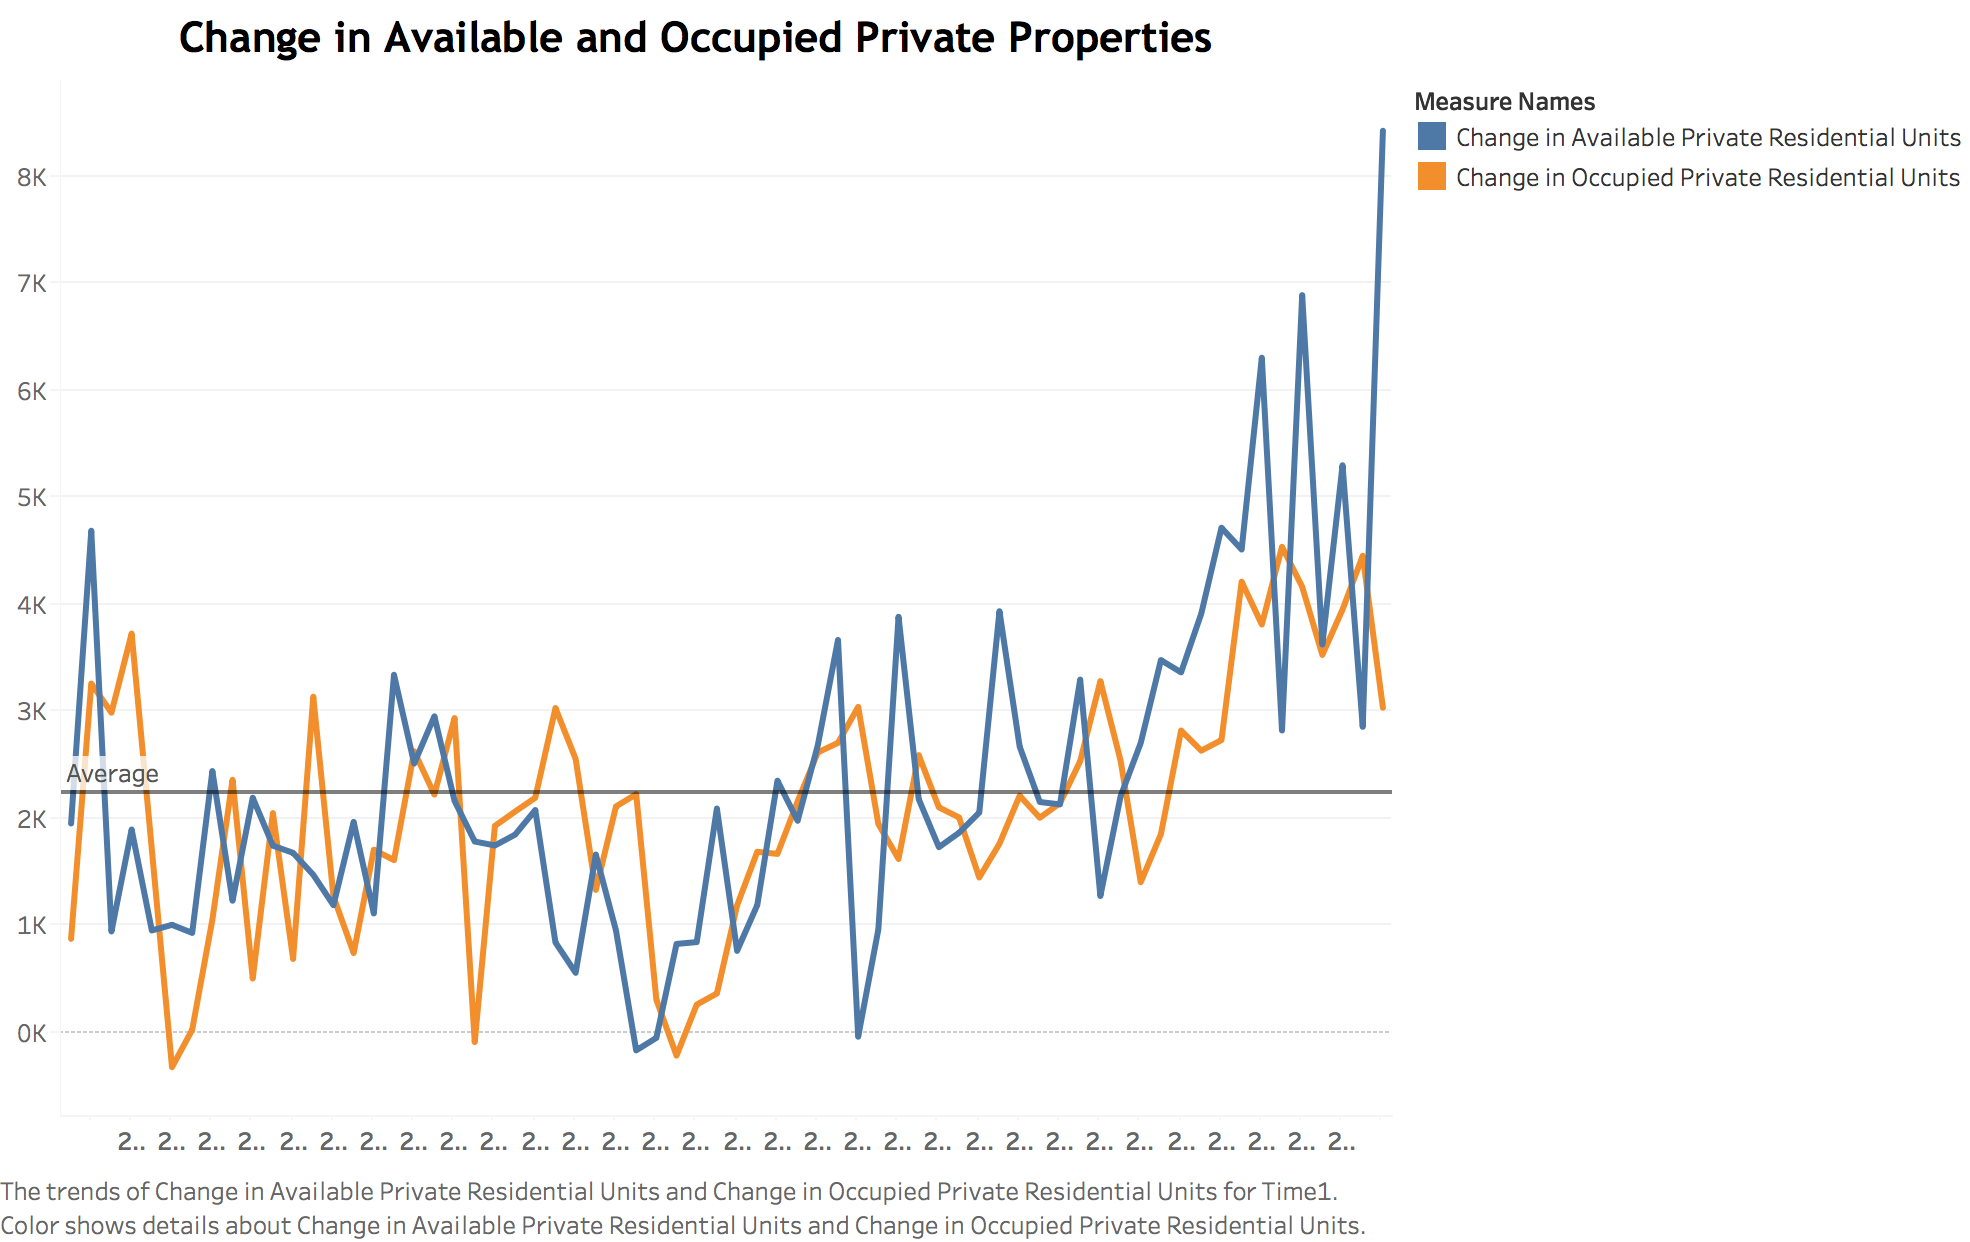
Before 2013, the number of available and completed private poverty units keeps a balance. After 2013, there is a rapid growth in the available private property which pushes up the number of completed private property. I insert an average line to show the rapid growth after 2013.
Change of Price and Rental Index

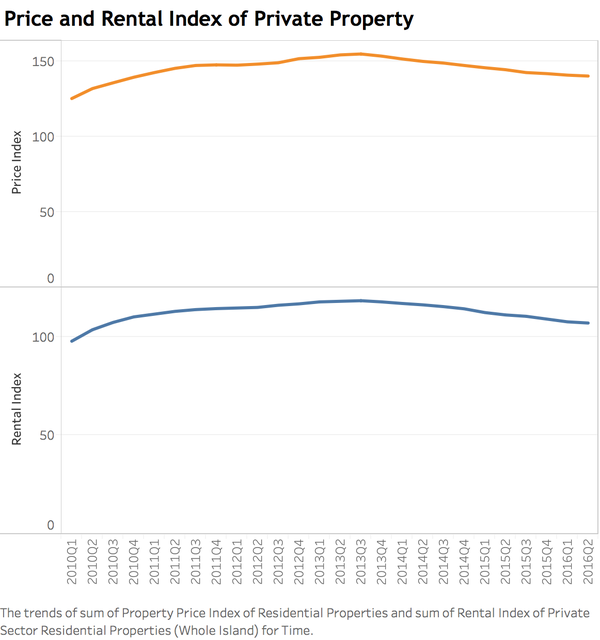
Price index and rental index keep the similar trend according to the booms and busts of economy. From 2013, the price of the private property and the rental of private property are declining slightly.
Vacancy Rate Change

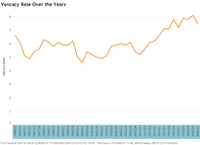
From 2006, the vacancy rate is climbing consistently. More vacant private houses are useless and cause a waste of resource.
Analysis
From the Vacancy Rate chart, we can see the vacancy rate is growing up which means there are more unoccupied property out there. In the meanwhile, Singapore has reached the highest vacancy rate since 10 years ago and released the empty houses without urgent demand. Cooling measures indeed reduce the excessively high house price but also make property developers suffering and keep foreign investors away. Form the available and completed chart we see, under this situation , the available private property is rapidly growing which will intense existing vacancy problem. Because of the slackening housing market, the price and rental cost obviously are declining which could freeze the private property market.
Tools Utilized
- Microsoft Excel – Data cleaning and transformation
- Tableau 10.0 – Chart generation and visualization
Suggestions
- Putting off or Give a break on cooling measures
- Encourage people upgrade from HDB flat to condos
- Provide guidance and renovation subsidy on private proverty
Conclusion
From the above charts, we can know that the private property market is facing a lacklustre now. Because of growing approvable construction projects, the problem will still go on. Therefore, we have to adjust our policy to face the challenge.