IS428 2016-17 Term1 Assign1 Tan Yong Kiong Alson
Infographics
Abstract
How can Singapore achieve its target of 6.5 million population in 2030?
We will look at the various supply and price distribution factors in terms of geographical location and property type to determine the policies to be implemented in 2016.
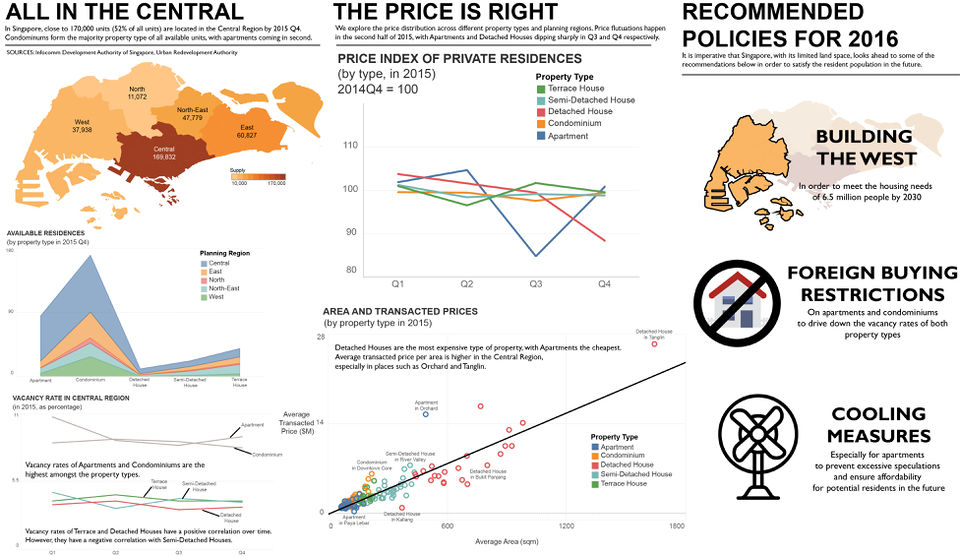
In Singapore, more than 50% of all available units reside in the Central Region. Therefore, Singapore must look towards the West Region for building of new units due to its larger untapped residential areas.
Due to high vacancy rates of apartments and condominiums in Central Region, foreign buying restrictions are required to stem out trend.
Cooling measures, especially for apartments, are necessary to stabilize prices and prevent excessive speculations. It also ensures affordability for potential residents in the future.
Problem and Motivation
The housing issue has always been a pressing issue since Singapore's independence in 1965. Its land-scarce geography makes Singapore one of the mostly densely-populated countries in the world, second only to Monaco. 50 years on, the problem remains and becomes compounded. How can Singapore house its targeted 6.5 million people by 2030?
The Singapore Government has introduced a slew of cooling measures since 2013 through the Monetary Authority of Singapore (MAS) to keep the property bubble from bursting. Then National Development Minister Khaw Boon Wan mentioned in an interview in 2015 that the housing situation 'much happier now' since the cooling measures are taken, but more work needs to be done.
This analysis will identify:
- the available and vacant private residential properties by type and region
- the price distribution of all private residential properties by type and region
This analysis aims to point out the important patterns surround the Singapore residential market, and make key recommendations to grow and stabilize the booming property market.
Approaches
In order to analyze the private residential market, the use of data from Real Estate Information System (REALIS) is essential. REALIS is an internet portal developed by the Urban Development Authority (URA) to provide timely and comprehensive coverage on Singapore property market. After retrieving the relevant time-series, stock and transaction data of all residential-related property data, the following data cleaning processes were made:
- The files downloaded are split into individual .csv files and it is not possible to analyse these data on Tableau. Hence, a new .csv file is created to consolidated the different property types and regions into a database suitable for analysis. An example of the data cleaning process is shown on the right.
- Based on the consolidated data on supply and price distribution factors, Tableau is used to observe the patterns and trends over various axis such as time, region and property type to make meaningful analysis of the residential property market.
- Once the visual analysis is completed, the file is exported as an Enhanced Metafile (*EMF) for high-quality vector images.
- Afterwards, these images are compiled using Adobe Illustrator for the working of the infographics.
A visualization map of Singapore is a very powerful tool to illustrate the geographical disparity in supply of units for this problem. Hence, the Master Plan Region Boundary 2014 dataset was retrieved [link], and the steps to create a visualization map are followed [link].
Tools Utilized
Microsoft Excel - For the data cleaning process so that it can be imported to Tableau for analysis
Tableau - For observation of trends and patterns, and data analysis
QGIS Desktop - For the formation and visualisation of the Singapore map and its planning regions/areas.
Adobe Illustrator - For the creation of visual infographics
Results
For this visualization map, a 10-stepped colour legend was used in order to distinguish the lesser-populated regions e.g. between West and North-East. The name of the region and the number of available units were denoted with black font on all 5 regions, except the Central Region with white font as the background is dark brown.
It was astonishing to find out that the Central Region make up more than half of all available residential units in Singapore. This will be used to carry out further analysis on the housing trends within the region.
The area under graph function was used in this particular visualization, in order to capture the supply disparity between the various regions using colours. The bigger the area under graph, the greater the supply for the region.
The zoom in and filter technique was used in creating this line graph to focus only on the Central Region. It was found that there is a causal relationship between the vacancy rates of Terrace, Detached and Semi-Detached Houses, whereas the vacancy rates of Apartments and Condominiums are twice as high compared to the other three property types.
The price index was obtained from the average prices of various property types in 2014 Q4. This was used to visualize the percentage difference compared to the base price. It is observed there for the price of apartments, there is a sharp dip from Q2 to Q3, and then rebounded back in Q4. Similarly for detached houses, the price dipped sharply from Q3 to Q4.
The area and transacted prices relationship serves two purposes:
- To find out the price distribution of various property types
- To find out the region which are the most expensive for the individual property types
It is observed that detached houses have the widest price distribution, and is the most expensive property types amongst the rest. Also, Central region has the most expensive properties for the individual property types.


