IS428 2016-17 Term1 Assign1 Lim Kim Yong
Contents
Abstract
This project aims to help potential buyers and property developers to gain an upper-hand in deciding where and when an attractive “entry point” by region or “entry time” by different quarters of the year is. Through the data visualization, it will help users to clearly identify areas/patterns/ trends of the distribution prices and supplies of different private property types in Singapore. Finally, it will then provide policy recommendations based on the findings.
Problem and Motivation
Prices of private homes fell 3.7 percent for the whole of 2015, according to data released by the Urban Redevelopment Authority (URA). Despite the fact that prices had dropped, and every Singaporeans would want to own a private property, the vacancy rates of private properties are still remaining high. Private properties are seen to be a good investment for many Singaporeans; however, the prices of private properties can be ranged from moderate to super expensive based on the regions/areas in Singapore. Hence, only high-income individuals/Singaporeans can afford to purchase them.
Furthermore, with fewer jobs being created, there has been a relatively lesser influx of expatriates moving to Singapore, which has caused a fluctuation in demand and supply. Expatriates, who jobs have been affected, have also moved out of Singapore. This has led to an increase in supply of home units.
In order to prevent this situation from occurring, it would not be meaningful to price new units based on what developers think is profitable, but rather more on what is affordable to buyers to drive sales. Therefore, it is imperative to closely analyze the private properties regions and introduce new policies or improvements, so that it will be a win-win situation for the potential buyers, developers, and the government.
The analysis will identify:
- Supply of private property types across different regions and districts.
- Distribution of sales prices of private property types across different regions in Singapore based on different quarters in Year 2015.
This analysis hopes to target on regions and districts in Singapore that has the highest vacancy rates and for potential buyers to have an informed decision when purchasing of private property.
Approaches
It is important to have domain knowledge in order to understand the terminologies used in the datasets. This can be done through the use of internet to research on the definitions and also by reading through some available materials to have a better understanding of the land policies and challenges faced in the current private properties market in Singapore. Subsequently, I have downloaded the statistical report of URA-Property Market Information and extracted data from REALIS database which is purely focusing on the private residential properties. There are 3 different tabs that I had made used of when collecting data for my analysis. They are:
- Time Series – This provides me with a compiled statistics filtered by the different property type that contains data such as Vacancy Rate and Vacancy Stock through the different regions – Central, East, North-East, North, and West from different quarters of the year.
- Transactions – This provides information containing the transacted prices of various property type based on their regions, districts, unit price psf., sales dates, etc.
- Stock – This provides information regarding to the supply of units for each property type based on their regions, areas, and the different quarters of the year.
Having all these massive amount of complex data, I begin to identify any connections/relevancies/entities between the data by using excel 2010. Certainly, there are some concerns for using the data straight in the raw form are:
- Removing redundant or irrelevant information and remove extra wordings that may cause Tableau to “misbehave” or show the error status.
- “Unfriendly” data arrangement that would cause error when raw data is imported straightly into Tableau.
Therefore, I cleaned up the data before I import them into Tableau to start generating charts or graphs for the purpose of data visualization.
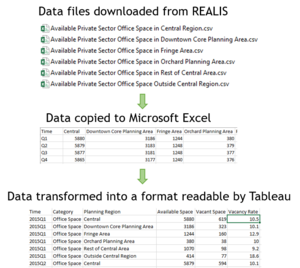
- The data downloaded is split into multiple csv files and it is not ‘analysis-friendly’. As such, a new excel file is created to consolidate all the data in each csv file for analysis to be carried out in Tableau. An example of the data cleaning process is shown on the right.
- The consolidated data is imported into Tableau. Using the drag and drop features in Tableau, a chart is then generated.
- Based on the chart findings, questions start to surface as to why the pattern or trend is happening. Possible reasons such as prices or location which might play a factor in the derivation of the pattern were identified.
- Filters were then further employed to analyse the data into greater detail. If required, more data is then collected to be used for analysis in order to identify a probable solution for the trend that is happening.
- The entire process of chart generation, identifying trends and finding reasons repeats until possible reasons about the trend happening has been identified.
Tools Utilized
The following tools were used during the project:
- Microsoft Excel – Data cleaning and transformation so that it can be imported into Tableau for analysis
- Tableau 10.0 – Chart generation and visualization to perform analysis to find patterns
- Photoshop CS6 - Creation of infographic to present complex information quickly and clearly.
- Microsoft Word - Document findings and results
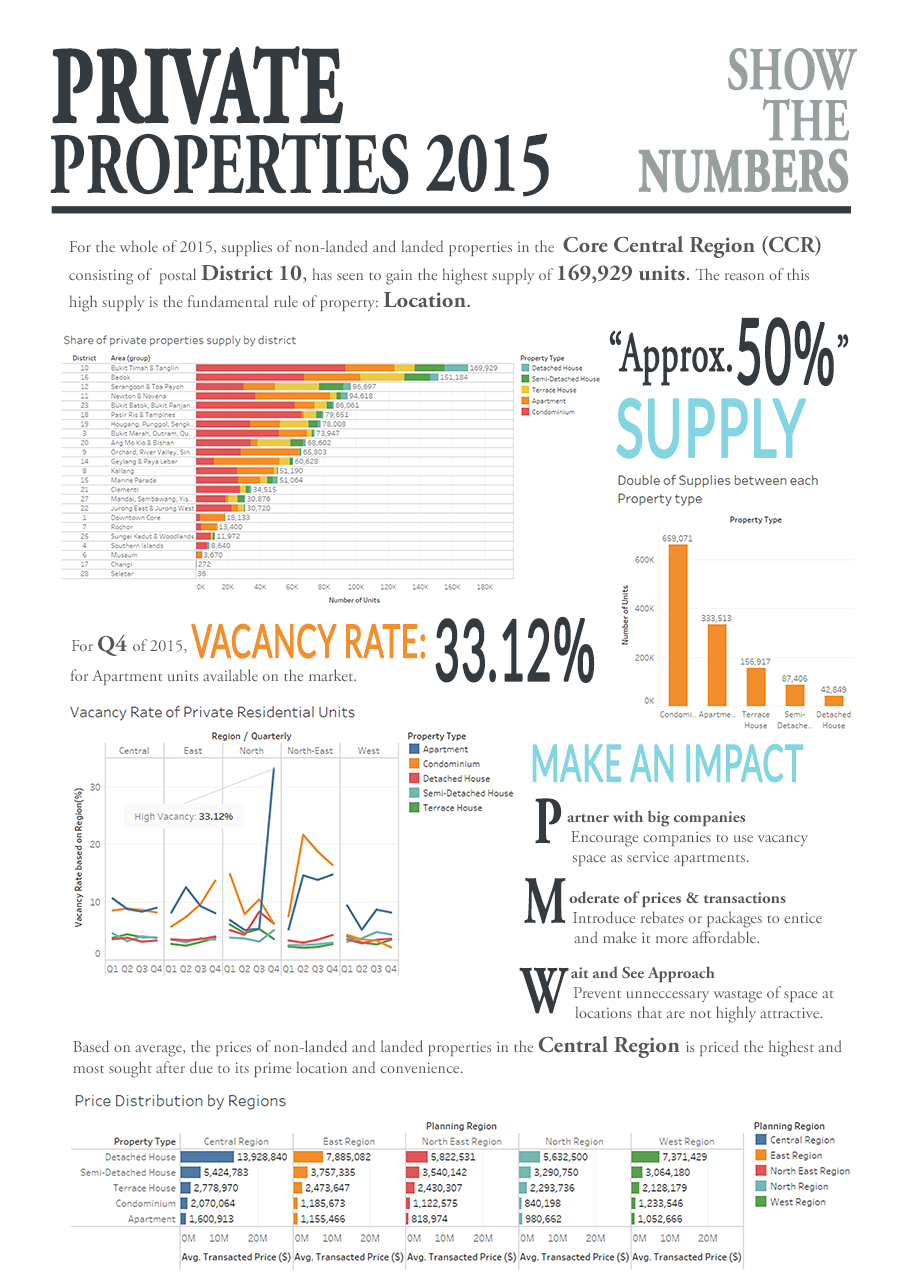
Infographic
Suggestions
Follow the "PMW" Approach
- "Wait and See Approach" to reduce the oversupply of private residential units. Governments and developers to slow down the supply of private properties to prevent unnecessary wastage of lands at locations that are not highly attractive.
- Moderate of prices and transaction. Introduce rebates or packages to attract make private properties more affordable for the buyers.
- Partner with big companies to reduce vacancy rates. Companies can use these empty spaces as service apartments for their employees or expatriates.

