Uncategorised files
Jump to navigation
Jump to search
Showing below up to 50 results in range #1,791 to #1,840.
View (previous 50 | next 50) (20 | 50 | 100 | 250 | 500)
 Timelinevisualgroupproject.PNG 1,079 × 538; 45 KB
 Timestamp1.png 689 × 493; 67 KB
 Timestamp2.png 2,467 × 1,537; 228 KB
 Toc.jpg 653 × 306; 11 KB
 Toc2.jpg 277 × 40; 4 KB
 Total Power.png 2,868 × 1,866; 189 KB
 Total Power Utilisation.jpg 1,907 × 1,005; 266 KB
 Total Supply of EC units occupied and vacant.png 1,731 × 1,263; 68 KB
 Total transacted price.png 888 × 960; 99 KB
 Totaldemand.PNG 973 × 389; 22 KB
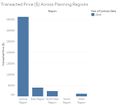 Transacted Price ($) Across Planning Regions.jpg 582 × 510; 35 KB
 Transaction number over area.png 1,271 × 963; 91 KB
 Transactions of property.png 716 × 552; 61 KB
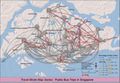 Travel Mode Map Series - Working Social Document.JPG 666 × 459; 61 KB
 Traveller distances - Working Social Document.JPG 805 × 659; 91 KB
 TreeVSsun.PNG 1,465 × 471; 654 KB
 Treemap.png 982 × 510; 75 KB
 Treemap001.jpg 1,245 × 817; 134 KB
 Treemap002.jpg 1,245 × 842; 213 KB
 TreemapByMonthsWorked.jpg 905 × 510; 159 KB
 TreemapInjuriesByIndustries.jpg 905 × 510; 47 KB
 TreemapInjuriesByMonths.jpg 905 × 510; 31 KB
 TreemapInjuriesByWeekdays.jpg 905 × 510; 28 KB
 Treemap Injury Type.jpg 984 × 784; 76 KB
 Treemap of Manual Work % and Industry.JPG 1,484 × 772; 103 KB
 Treemapsample.png 1,674 × 826; 198 KB
 Trellis.jpg 1,131 × 760; 119 KB
 Trellis2.jpg 1,035 × 780; 110 KB
 Trellis3.jpg 1,131 × 948; 150 KB
 Trend of Number of Units by Price Brackets and Region.png 2,194 × 1,289; 192 KB
 Trends1.png 780 × 494; 135 KB
 Trends2.png 778 × 521; 126 KB
 Trends3.png 765 × 509; 44 KB
 Trends4.png 783 × 519; 87 KB
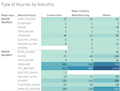 Type of Injuries by Industry.png 583 × 444; 39 KB
 Type of Injury.jpg 1,063 × 633; 93 KB
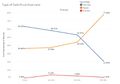 Type of Sale.JPG 808 × 566; 41 KB
 Types of Private Properties in Singapore.jpg 888 × 460; 43 KB
 TypicalbreakLoc.PNG 2,707 × 1,646; 51 KB
 TypicaldayLoc.PNG 1,872 × 1,186; 78 KB
 UCINETComparison.JPG 1,266 × 737; 169 KB
 URA-private-residential-property-price-index-2015.png 1,275 × 678; 90 KB
 Ueconomics.png 586 × 304; 56 KB
 Uncompleted Landed sold and unsold.png 2,141 × 1,313; 120 KB
 Uncompleted Non-Landed sold and unsold.png 2,181 × 1,313; 115 KB
 Underscores1.png 971 × 837; 174 KB
 Ungrouped.png 296 × 189; 8 KB
 Union transactions.png 798 × 527; 56 KB
 Unit Price (psm).JPG 985 × 420; 54 KB
 Unitsbytype.PNG 1,539 × 1,366; 82 KB


_Across_Planning_Regions.jpg)


.JPG)
