IS428 2016-17 Term1 Assign3 Chua Feng Ru
Contents
Problem & Motivation
While the new office is built to the highest energy efficiency standard, the problem is that there are still several HVAC issues to work out. And thus, the motivation is to use visual analytics to find out what are the most probable issues within the new building.
Data Cleaning and Transformation
Building Data
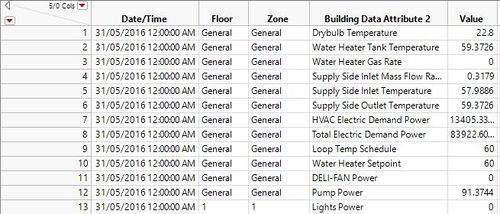
As for the initial building data, the data is structured such that each record or row has multiple columns as the data elements. The first step is to use JMP Pro to structure the data in the format of (Date/Time, Floor, Zone, Building Data Attribute, Value).
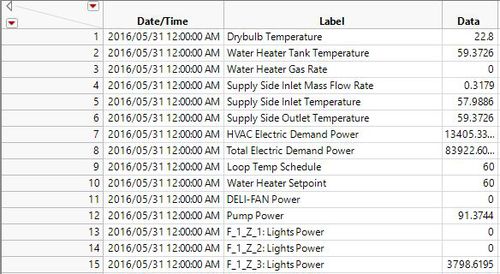
The process in transforming the data, is to first use the "Stack" feature of JMP Pro. This will allow me to format the data as below:
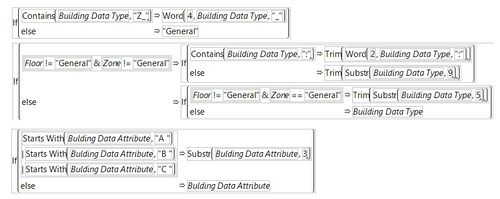
However, I realised that certain fields still contain Floor and Zone information. Thus, I used a series of formulas to separate the Floor and Zone information from the label. The following are the formulas which are used to accomplish the data cleaning process.
Hazium Concentration Data
For the Hazium Concentration Data, I realised that there are the files are splitted according to the sensors in each zone or floor. The first thing to do is to join the files together into 1 single table, with JMP Pro's "Concatenate" table function.
After that is done, I perform similar function of using the "Stack" feature to restructure the data as of below:


