Difference between revisions of "IS428 2016-17 Term1 Assign1 Liu Bowei"
| Line 19: | Line 19: | ||
====Pattern 2==== | ====Pattern 2==== | ||
| + | [[File:BWPic2.png|600px]] | ||
| + | |||
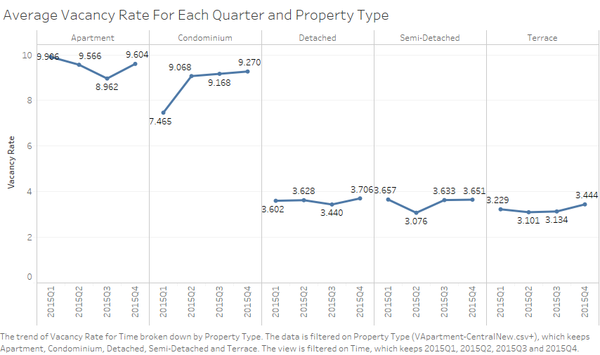
| + | There is a general increasing trend for the vacancy rate for Condominiums, Detached and Terrace. The increasing trend is especially obvious with Condominiums, increasing by almost 2 percent in 1 year. Another point to note is that although there is a general decreasing trend for Apartments, there is a sharp increase in vacancy rate in the last quarter of the year. I have thus decided to focus on the high vacancy rate in the two non-landed property types due to their high number of vacancies, as well as the increasing trend of vacancy rate. | ||
====Pattern 3==== | ====Pattern 3==== | ||
| + | [[File:BWPic3.png|600px]] | ||
| + | |||
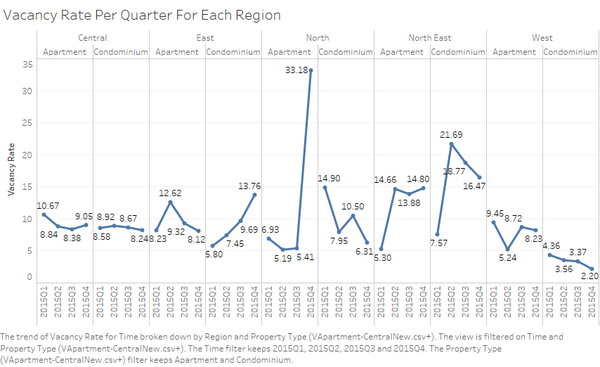
| + | I plotted distribution of the vacancy rate for the property types of Apartment and Condominium for each region. There is a sharp rise in vacancy for Condominium in the East Region and for Apartment in the North Region. Furthermore, vacancy for both property types in the North East Region remains high, despite drops in its vacancy for the third and fourth quarter of the year. | ||
===Analyzing distribution of private properties prices=== | ===Analyzing distribution of private properties prices=== | ||
Revision as of 07:50, 29 August 2016
Contents
Abstract
Problem and Motivation
Singapore is a small country (719 Square Kilometers), with a growing population (5.54 million). Finding ways to house such a large number of citizens on such limited land is a valid concern, and the country needs to be able to use its remaining undeveloped lands wisely. As such, urban planning is important, especially in terms of housing. Using transaction data from the REALIS Database, I intend to identify patterns in the price and supply of private residential properties.
Approaches
Pattern 1
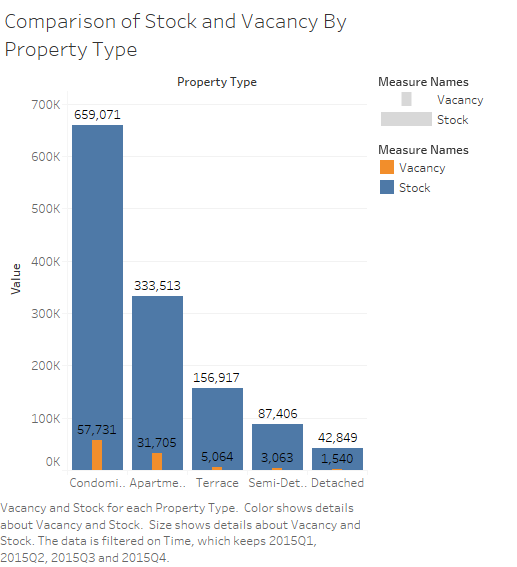
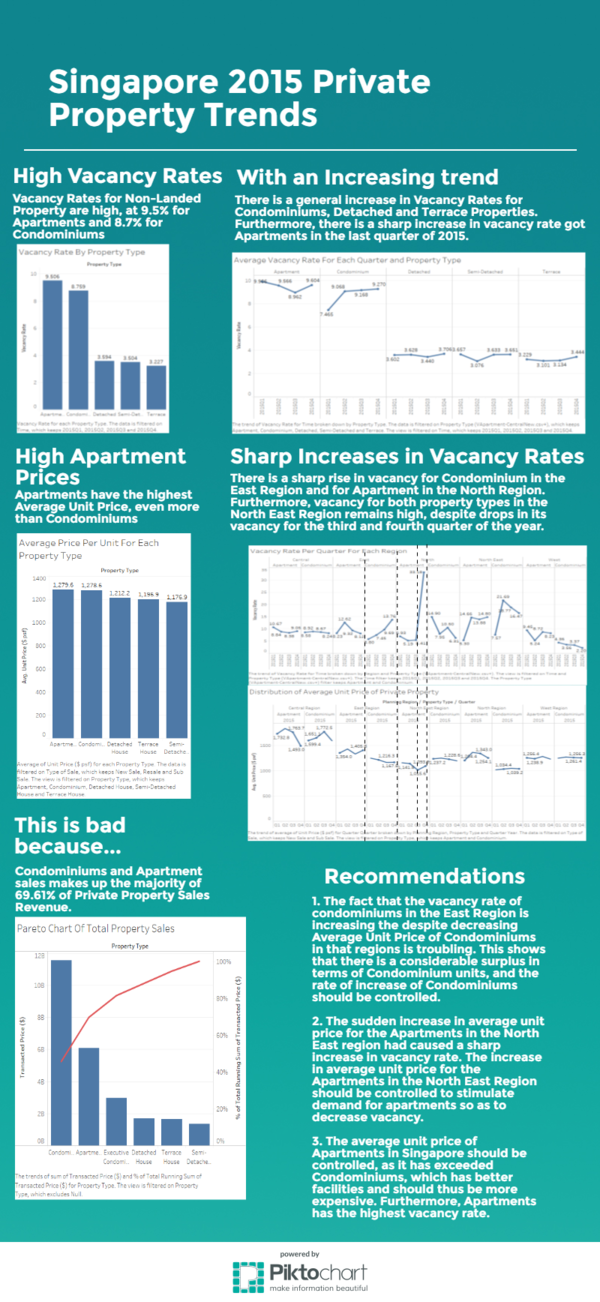
To get a glimpse of how the supply of private residential properties is distribution across the different property types, I created a bar graph with property type and the x-axis and number of units as the y-axis. We can see from this graph that Condominiums and Apartments make up a majority of the supply.
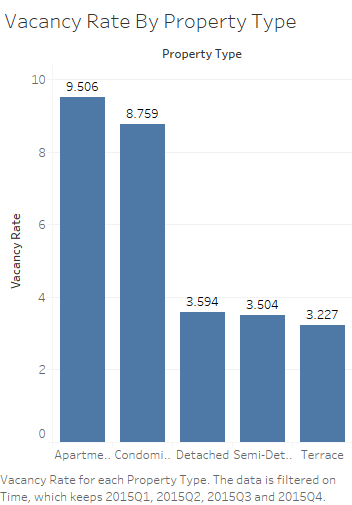
I then created a bar chart to visualize the vacancy rate for each property type. The vacancy rate for Apartments and Condominiums are significantly higher than the other property types, with vacancy rate in Apartments being the highest.
Pattern 2
There is a general increasing trend for the vacancy rate for Condominiums, Detached and Terrace. The increasing trend is especially obvious with Condominiums, increasing by almost 2 percent in 1 year. Another point to note is that although there is a general decreasing trend for Apartments, there is a sharp increase in vacancy rate in the last quarter of the year. I have thus decided to focus on the high vacancy rate in the two non-landed property types due to their high number of vacancies, as well as the increasing trend of vacancy rate.
Pattern 3
I plotted distribution of the vacancy rate for the property types of Apartment and Condominium for each region. There is a sharp rise in vacancy for Condominium in the East Region and for Apartment in the North Region. Furthermore, vacancy for both property types in the North East Region remains high, despite drops in its vacancy for the third and fourth quarter of the year.
