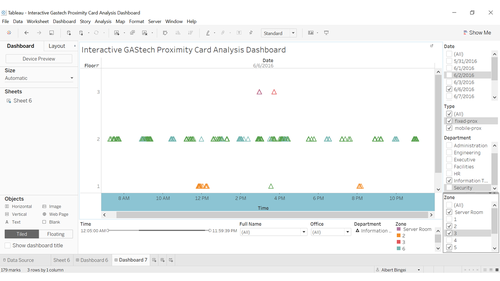
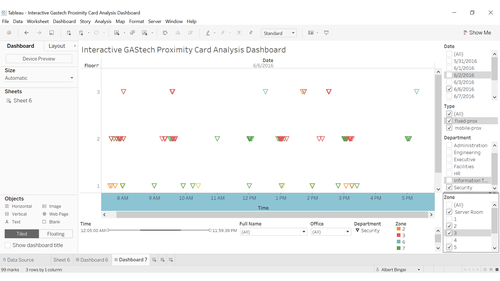
Difference between revisions of "IS428 2016-17 Term1 Assign3 Albert Bingei"
Albertb.2013 (talk | contribs) |
Albertb.2013 (talk | contribs) |
||
| (7 intermediate revisions by the same user not shown) | |||
| Line 3: | Line 3: | ||
This wiki page intends to explore the dataset of GASTech prox and building data. An interactive dashboard is presented below for the user's perusal. | This wiki page intends to explore the dataset of GASTech prox and building data. An interactive dashboard is presented below for the user's perusal. | ||
<br> | <br> | ||
| − | Please zoom out accordingly to fit entire dashboard onto your screen. The settings have been adjusted to automatically to fit all screen sizes. | + | |
| + | Please zoom out accordingly to fit entire dashboard onto your screen. The settings have been adjusted to automatically to fit all screen sizes. | ||
| + | |||
<br> | <br> | ||
The link to the interactive dashboard can be found here: | The link to the interactive dashboard can be found here: | ||
| Line 18: | Line 20: | ||
# Added the hazium concentration data into the main bldg.-MC2 excel and into each floor. This eliminates the needs for the following csv files: f1z8a-MC2, f2z2-MC2, f2z4-MC2, f3z1-MC2 | # Added the hazium concentration data into the main bldg.-MC2 excel and into each floor. This eliminates the needs for the following csv files: f1z8a-MC2, f2z2-MC2, f2z4-MC2, f3z1-MC2 | ||
# Imposed prox mobile out file into scatterplot by floor with JMP to identify their zones. Care is taken to ensure x axis of the grid is from 0 to 189 while the x axis is 0 to 111 to ensure the most accurate mapping possible. Output into a powerpoint slide for easy reference. | # Imposed prox mobile out file into scatterplot by floor with JMP to identify their zones. Care is taken to ensure x axis of the grid is from 0 to 189 while the x axis is 0 to 111 to ensure the most accurate mapping possible. Output into a powerpoint slide for easy reference. | ||
| + | |||
| + | {| class="wikitable" | ||
| + | |- | ||
| + | ! Floor 1 !! Floor 2 !! Floor 3 | ||
| + | |- | ||
| + | | [[File:wave1floor1.PNG|300px]] || [[File:wave1floor2.PNG|300px]] || [[File:wave1floor3.PNG|300px]] | ||
| + | |} | ||
| + | |||
# Created employee IDs to match prox IDs using concatenate and vlookup function in excel (eg. tquiroz001) This eliminates the need for the file Employee List.xlsx since the proxout and proxmobile files have the employee information including First and last names, department and office. Care is taken to match the created employee ID to match with the closest row of employee on the best guess. | # Created employee IDs to match prox IDs using concatenate and vlookup function in excel (eg. tquiroz001) This eliminates the need for the file Employee List.xlsx since the proxout and proxmobile files have the employee information including First and last names, department and office. Care is taken to match the created employee ID to match with the closest row of employee on the best guess. | ||
# Created 3 sensor mobile lists by floor to convert all the (x,y) coordinates into zones. First floor coordinates are relatively few so we assume the zone where the robot intended to measure the badges from instead of its absolute location. Floors 2 and 3 are where we hard enforce the absolute location of the robot standing in which zone. | # Created 3 sensor mobile lists by floor to convert all the (x,y) coordinates into zones. First floor coordinates are relatively few so we assume the zone where the robot intended to measure the badges from instead of its absolute location. Floors 2 and 3 are where we hard enforce the absolute location of the robot standing in which zone. | ||
# Merged the mobile prox and the fixed prox into one excel sheet with 41,355 entries for easier management and analysis. | # Merged the mobile prox and the fixed prox into one excel sheet with 41,355 entries for easier management and analysis. | ||
# Transformed all the zones on Excel such that we have 32,256 entries with a new zone column with the data for Lights Power, Equipment Power, Thermostat Temp, Thermostat Heating Setpoint, Thermostat Cooling Setpoint, VAV REHEAT Damper Position, REHEAT COIL Power, RETURN OUTLET CO2 Concentration, SUPPLY INLET Temperature, SUPPLY INLET Mass Flow Rate | # Transformed all the zones on Excel such that we have 32,256 entries with a new zone column with the data for Lights Power, Equipment Power, Thermostat Temp, Thermostat Heating Setpoint, Thermostat Cooling Setpoint, VAV REHEAT Damper Position, REHEAT COIL Power, RETURN OUTLET CO2 Concentration, SUPPLY INLET Temperature, SUPPLY INLET Mass Flow Rate | ||
| + | # Parsed the dates times into hours and minutes and added the day (monday to sunday) for easier analysis on the individual floor data files | ||
| + | # Compiled a variable view list and classified the different variables into the HVAC categories (Heating, Ventilation and Aircon) and its further subdivisions | ||
| + | |||
| + | [[File:Wave1varview.PNG|500px]] | ||
== Typical patterns in prox card data == | == Typical patterns in prox card data == | ||
| − | Daily route for Rosie. Based on observation of the data, Rosie starts the day by going to the 1st floor at 9am then to the 2nd floor and 3rd floor back to 1st floor at 10am, the route and tour complete within 1 hour. Rosie repeats again from 2pm to 3pm. This has a very fixed timing and route. Here we ask ourselves if Rosie’s current route can be improved? [File: | + | Daily route for Rosie. Based on observation of the data, Rosie starts the day by going to the 1st floor at 9am then to the 2nd floor and 3rd floor back to 1st floor at 10am, the route and tour complete within 1 hour. Rosie repeats again from 2pm to 3pm. This has a very fixed timing and route. Here we ask ourselves if Rosie’s current route can be improved? |
| + | |||
| + | [[File:wave1rosie1hour.PNG|400px]] | ||
| + | [[File:wave1rosietime.PNG|400px]] | ||
== Typical Day of a GAStech employee == | == Typical Day of a GAStech employee == | ||
| − | + | {| class="wikitable" | |
| − | + | |- | |
| − | + | ! Screenshot !! Description | |
| − | + | |- | |
| − | + | | [[File:wave1admin.PNG|500px]] || Administration personnel have simple 7am to 5:30pm days. They frequent zone 1 (corridors) and zone 4 (Mech Elevators) which indicates lots of movement for these people from place to place within the building. | |
| − | + | |- | |
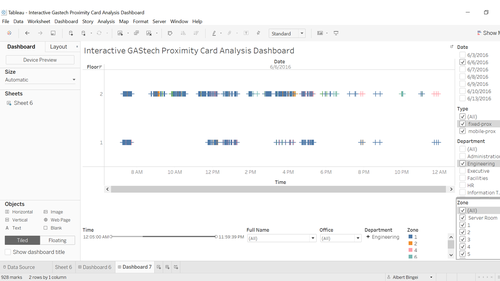
| − | + | | [[File:wave1engin.PNG|500px]] || Engineering personnel start work at 7am and do not access floor 3. Perhaps they do not have security clearance to access that floor. They always eat together punctually at 12pm at the Deli (floor 1 zone 2) and they work mostly at floor 2 zone 2 offices. Some engineers work overtime all the way to 12am while most will leave by 6pm. | |
| − | + | |- | |
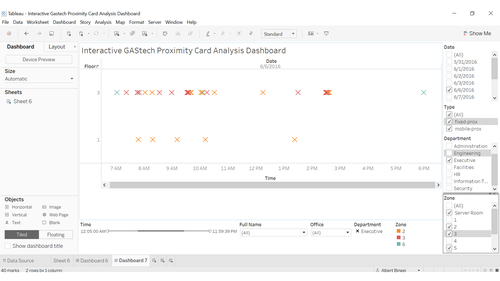
| + | | [[File:wave1exec.PNG|500px]] || Executive personnel generally have 9:30am to 3pm days and do not access floor 2, though some come in at 7am and others leave at 6pm. | ||
| + | |- | ||
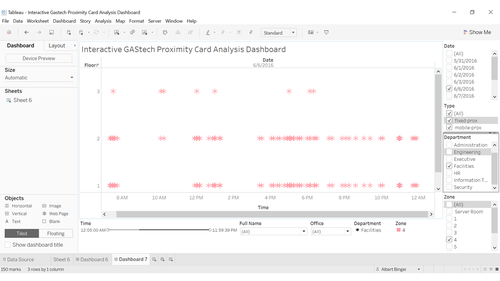
| + | | [[File:wave1facil.PNG|500px]] || Facilities personnel have long days from 7am to about 12am and there are some shift work through the night shift. These personnel move around a lot as shown by their frequent zone 1 and zone 4 in the building, more than the administration personnel. Mostly based on floor 2, zone 6 and 7 area. | ||
| + | |- | ||
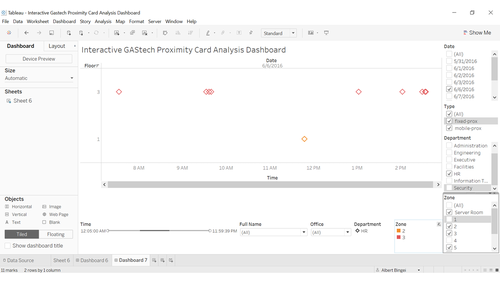
| + | | [[File:wave1hr.PNG|500px]] || HR personnel have regular 7am to 6pm days and occasionally access floor 2. Their office is on floor 3 zone 3. | ||
| + | |- | ||
| + | | [[File:wave1it.PNG|500px]] || Information Technology personnel work long hours from 7am to 12am. They are similar to Engineering people who eat together at 12pm and 8pm at the deli. Their offices are at floor 2 zone 7 and hold occasional meetings at the meeting training room at floor 2 zone 6 from 1030am to about 2pm | ||
| + | |- | ||
| + | | [[File:wave1security.PNG|500px]] || Security personnel works from 7am to 5pm surprisingly instead of the long day expected. Lots of movement from floor 2 zone 7 to zone 3 indicates that security command centre is that of room 2170. | ||
| + | |} | ||
| + | |||
| + | == Interesting patterns== | ||
| + | == Notable anomalies or Unusual events== | ||
| + | {| class="wikitable" | ||
| + | |- | ||
| + | ! Screenshot !! Description | ||
| + | |- | ||
| + | | [[File:floor1haz.png|500px]] || Floor 1 Hazium concentration is unusually high in zone 8A on Thursday 9 june and 7am 11 june Saturday 6pm. | ||
| + | |- | ||
| + | | Example || Example | ||
| + | |- | ||
| + | | Example || Example | ||
| + | |} | ||
| − | |||
| − | |||
== Relationships== | == Relationships== | ||
== Conclusion == | == Conclusion == | ||
Latest revision as of 10:25, 24 October 2016
Contents
Overview
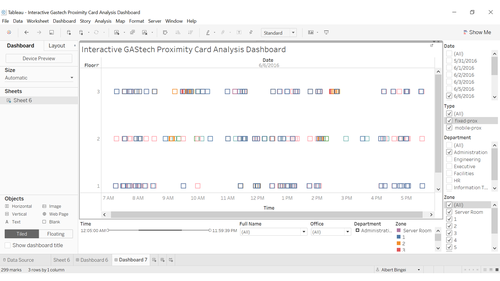
This wiki page intends to explore the dataset of GASTech prox and building data. An interactive dashboard is presented below for the user's perusal.
Please zoom out accordingly to fit entire dashboard onto your screen. The settings have been adjusted to automatically to fit all screen sizes.
The link to the interactive dashboard can be found here:
https://public.tableau.com/profile/albert.bingei#!/vizhome/InteractiveGastechProximityCardAnalysisDashboard/Dashboard7
- What are the typical patterns in the prox card data? What does a typical day look like for GAStech employees?
- Describe up to ten of the most interesting patterns that appear in the building data. Describe what is notable about the pattern and explain its possible significance.
- Describe up to ten notable anomalies or unusual events you see in the data. Prioritize those issues that are most likely to represent a danger or a serious issue for building operations.
- Describe up to five observed relationships between the proximity card data and building data elements. If you find a causal relationship (for example, a building event or condition leading to personnel behavior changes or personnel activity leading to building operations changes), describe your discovered cause and effect, the evidence you found to support it, and your level of confidence in your assessment of the relationship.
Data Cleaning procedures
- Created 3 excel files distinguished by floor based on bldg-MC2 and retained the original bldg-MC2 file.
- Added the hazium concentration data into the main bldg.-MC2 excel and into each floor. This eliminates the needs for the following csv files: f1z8a-MC2, f2z2-MC2, f2z4-MC2, f3z1-MC2
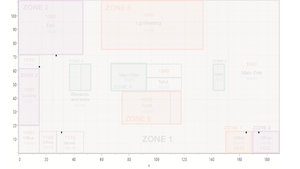
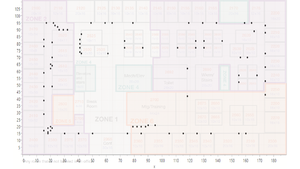
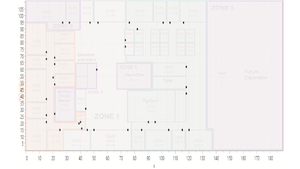
- Imposed prox mobile out file into scatterplot by floor with JMP to identify their zones. Care is taken to ensure x axis of the grid is from 0 to 189 while the x axis is 0 to 111 to ensure the most accurate mapping possible. Output into a powerpoint slide for easy reference.
| Floor 1 | Floor 2 | Floor 3 |
|---|---|---|
 |
 |
|
- Created employee IDs to match prox IDs using concatenate and vlookup function in excel (eg. tquiroz001) This eliminates the need for the file Employee List.xlsx since the proxout and proxmobile files have the employee information including First and last names, department and office. Care is taken to match the created employee ID to match with the closest row of employee on the best guess.
- Created 3 sensor mobile lists by floor to convert all the (x,y) coordinates into zones. First floor coordinates are relatively few so we assume the zone where the robot intended to measure the badges from instead of its absolute location. Floors 2 and 3 are where we hard enforce the absolute location of the robot standing in which zone.
- Merged the mobile prox and the fixed prox into one excel sheet with 41,355 entries for easier management and analysis.
- Transformed all the zones on Excel such that we have 32,256 entries with a new zone column with the data for Lights Power, Equipment Power, Thermostat Temp, Thermostat Heating Setpoint, Thermostat Cooling Setpoint, VAV REHEAT Damper Position, REHEAT COIL Power, RETURN OUTLET CO2 Concentration, SUPPLY INLET Temperature, SUPPLY INLET Mass Flow Rate
- Parsed the dates times into hours and minutes and added the day (monday to sunday) for easier analysis on the individual floor data files
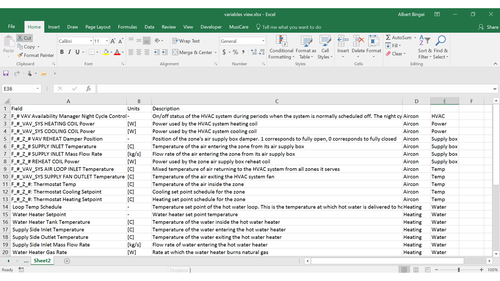
- Compiled a variable view list and classified the different variables into the HVAC categories (Heating, Ventilation and Aircon) and its further subdivisions
Typical patterns in prox card data
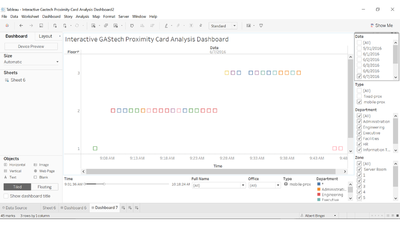
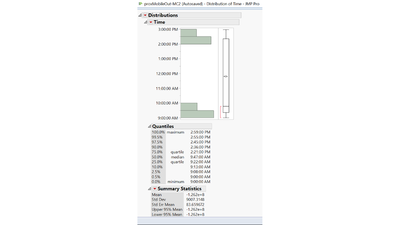
Daily route for Rosie. Based on observation of the data, Rosie starts the day by going to the 1st floor at 9am then to the 2nd floor and 3rd floor back to 1st floor at 10am, the route and tour complete within 1 hour. Rosie repeats again from 2pm to 3pm. This has a very fixed timing and route. Here we ask ourselves if Rosie’s current route can be improved?
Typical Day of a GAStech employee
Interesting patterns
Notable anomalies or Unusual events
| Screenshot | Description |
|---|---|
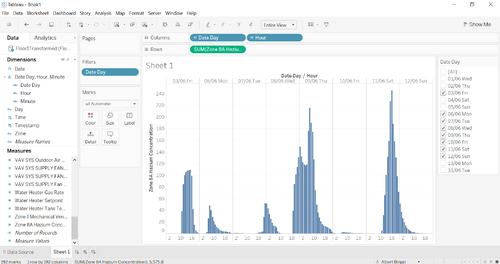 |
Floor 1 Hazium concentration is unusually high in zone 8A on Thursday 9 june and 7am 11 june Saturday 6pm. |
| Example | Example |
| Example | Example |
