Difference between revisions of "Cupid Minions"
| (3 intermediate revisions by 2 users not shown) | |||
| Line 11: | Line 11: | ||
[[Team Cupid Minions Application | <font color="#ffffff" size=2><b>APPLICATION</b></font>]] | [[Team Cupid Minions Application | <font color="#ffffff" size=2><b>APPLICATION</b></font>]] | ||
| style="background-color:#ffb7c5; text-align:center;" width="25%" | | | style="background-color:#ffb7c5; text-align:center;" width="25%" | | ||
| − | [[Team Cupid Minions | + | [[Team Cupid Minions Report | <font color="#ffffff" size=2><b>REPORT</b></font>]] |
|} | |} | ||
| Line 60: | Line 60: | ||
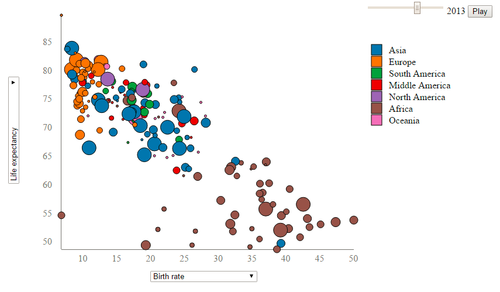
||[[File:Cupid Visualization.png|500px|center]] | ||[[File:Cupid Visualization.png|500px|center]] | ||
|<center>'''Interactive Demographic Graph Using D3.js with Slider and Play Button'''</center> | |<center>'''Interactive Demographic Graph Using D3.js with Slider and Play Button'''</center> | ||
| + | *http://www.codeproject.com/Articles/1089925/Build-a-Demographic-Data-Visualization-Tool-Based | ||
*Highly interactive (slider, filters) | *Highly interactive (slider, filters) | ||
*Suitable for data with high number of dimensions (In our case, the attributes include gender, race, education, interests and a lot more) | *Suitable for data with high number of dimensions (In our case, the attributes include gender, race, education, interests and a lot more) | ||
| Line 65: | Line 66: | ||
|- | |- | ||
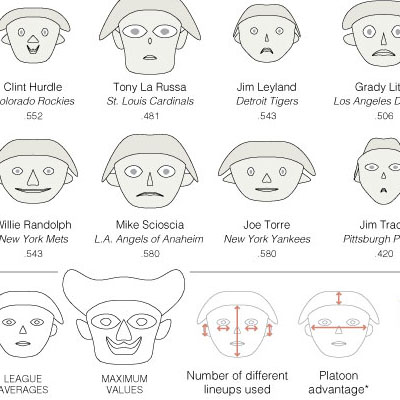
| − | ||[[File: | + | ||[[File:Chernoff Face.png|thumbnail|500px|center]] |
| − | |<center>''' | + | |<center>'''Chernoff Face'''</center> |
| − | * | + | *http://mathworld.wolfram.com/ChernoffFace.html |
| − | * | + | *Face shape is suitable for visualizing demographics data |
| + | *Intuitive for displaying multiple variables and comparison (In our case, the attributes include gender, race, education, interests and a lot more) | ||
| + | |- | ||
| + | |||
| + | |- | ||
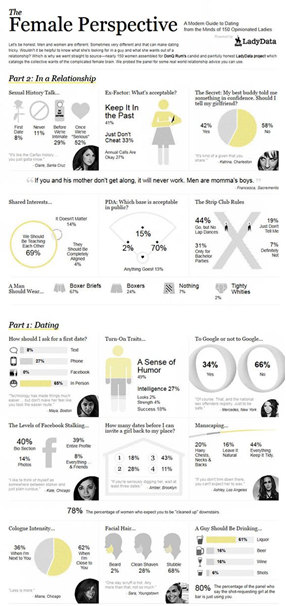
| + | ||[[File:Female Perspective.png|thumbnail|500px|center]] | ||
| + | |<center>'''Dating Dashboard Design'''</center> | ||
| + | *http://www.valetmag.com/living/features/2010/the-female-perspective.php | ||
| + | * The Female perspective on dating Dashboard design | ||
|- | |- | ||
|} | |} | ||
Latest revision as of 15:26, 9 October 2016
Contents
Problem and Motivation
Low marriage rate and increasing divorce rate has been prominent issues in the developed world. One of the reasons for causing these issues is the wrong selection of marriage partner. Some couples only know that they don’t suit each other after marriage. This creates social issues like increaing divorce rate and domestic violence. Therefore, choosing the correct marriage partner is a prompt need for the young adults nowadays. In order to increase the successful matching rate for couples and make sure people can get the most satisfied partners, there is a need to understand these partner-seeking people’s characterstics, demographics, habits and lifestyle informations, etc. From the insight brought by the data, we could suggest the factors which contribute to successful and rapid matching and as a result help the partner-seekers.
Objective
Our project aims to explore the potential attributes contributing to people’s decision during speed-dating. This enables us to have a deeper understanding of dating preferences that examine a large variety of social issues. Our fields of interests range from race relations to intergenerational mobility, which largely depends upon outcomes of marriage market.
The detail questions for directing data analysis in this project are:
- How does external facters affect one’s choice of partner:
- e.g. income and current career
- How does demographics affect one’s choice of partner:
- e.g. race
- What are the most desirable and least desirable attributes for choosing opposite sex partners:
- attractiveness.
- sincere
- intelligent
- fun
- ambitious
- shared interests
Data
Data used in this project was compiled by Columbia Business School professors Ray Fisman and Sheena Iyengar for their paper Gender Differences in Mate Selection: Evidence From a Speed Dating Experiment.
This dataset was originally collected from experimental speed dating events participants during the period of 2002-2004. Participants were given four minutes 'speed dating' time with another participant of opposite sex. After their 'speed dating', they were requested to rate their corresponding 'dating partners' on six aspects:
- Attractiveness
- Sincerity
- Intelligence
- Fun
- Ambition
- Shared Interests
On top of which, questionnaire data was collected from the participants and recorded in the dataset throughout the process. Questionnaire data that we may find relevant and useful include:
- Demographics
- Dating habits
- Self-perception across key attributes
- Beliefs on what others find valuable in a mate
- Lifestyle information
Research Visualisation
| Visualisations | Comments |
|---|---|
| |
| |
|
Tools
Following tools are expected to be utilized through this project:
- Tableau DeskTop 10
- JMP Pro
- Javascript
- D3.js
- JQuery
- Brackets
- Github
- Excel
Technical Challenges
| Technical Challenges | Action Plan |
|---|---|
| |
| |
|
Roles & Milestones
References
- Reasearch paper: Gender Differences in Mate Selection: Evidence From a Speed Dating Experiment.
(Raymond Fisman Sheena S. Iyengar Emir Kamenica Itamar Simonson) - Racial Preferences in Dating
(Raymond Fisman Sheena S. Iyengar Emir Kamenica Itamar Simonson) - Speed Dating Experiment Data
- Build a Demographic Data Visualization Tool Based On D3.js
- The Data Visualization Catalog
- D3 Gallery
Chart.js
JavaScript Chart Comparison


