Difference between revisions of "IS428 2016-17 Term1 Assign2 Yang Chengzhen"
Czyang.2013 (talk | contribs) |
Czyang.2013 (talk | contribs) |
||
| (23 intermediate revisions by the same user not shown) | |||
| Line 8: | Line 8: | ||
== Research Question == | == Research Question == | ||
| − | * | + | * How does injuries distribute in different industries? |
| − | * What characteristics do the | + | * What characteristics do the victim groups have? |
| − | * | + | * Does Company size matter in number of injuries? |
| − | * | + | * Are companies with different size indifferent with MC policy? |
<br> | <br> | ||
| Line 18: | Line 18: | ||
==Attribute Selection== | ==Attribute Selection== | ||
There are 48 columns in the raw data. After scanning through, I selected some attributes which are more relevant in identifying victim groups: | There are 48 columns in the raw data. After scanning through, I selected some attributes which are more relevant in identifying victim groups: | ||
| − | |||
| − | |||
| − | |||
* Nature of Injury | * Nature of Injury | ||
* Major Industry | * Major Industry | ||
| Line 29: | Line 26: | ||
* Injured When Working Overtime | * Injured When Working Overtime | ||
| − | = Data | + | ==Data Preparation== |
| + | ===Check Missing Values=== | ||
| + | Use JMP to find missing data pattern relating to the attributes selected in the previous section, only one missing data is found. I decided to ignore the record since it has no significant impact to the analysis. | ||
| + | [[File:Cz-Missing-1.png|600x600px]] <br> | ||
| + | ===Check Distribution of Numerical Attribute === | ||
| + | [[File:Cz-age-distribution.png|200x400px]] | ||
| + | [[File:Cz-noof employees.png|200x400px]] | ||
| + | [[File:Cz-mcdays.png|200x400px]] | ||
| + | <br> | ||
| + | |||
| + | = Data Visualization and Findings = | ||
| + | #Access Final outcome here [[https://public.tableau.com/profile/publish/MA2_YangChengzhen/FinalDashboard#!/publish-confirm]] | ||
| + | ==1.How does injuries distribute in different industries?== | ||
| + | ===Overview with Injury distribution by industry=== | ||
| + | * Industry has many categories. In order to have a intuitive view of the distribution of injury, I used hierachy in Tableau to visualize the data.<br> | ||
| + | * '''From the hierarchical view, we can tell "Construction" has the highest injury cases among all the industries The other 'high injury cases' industries are Metalworking, Accommodation and Wholesale&Retail Trade.<br> | ||
| + | [[File:Major-sub-industry.png|1500px]] | ||
| + | |||
| + | ===Further Explore:Nature of Injury === | ||
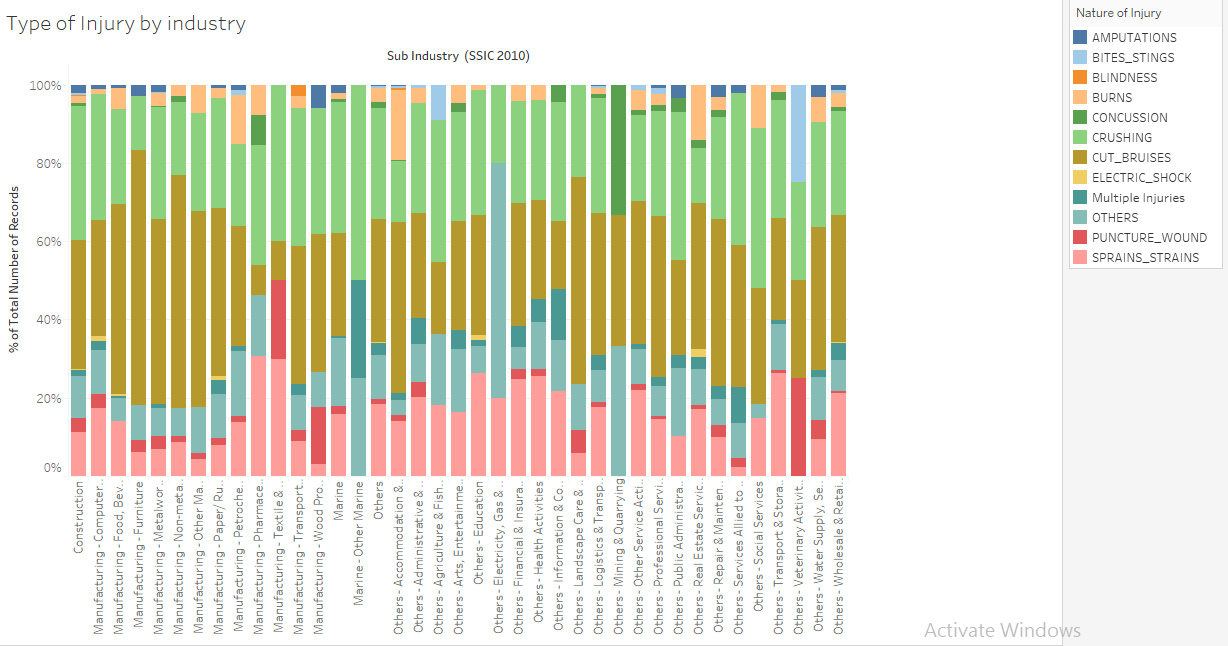
| + | * By Using mosaic plot, we are able to see the distribution of nature of injury by color coding. We can check the detailed frequency percentage by mouse over to the corresponding bars | ||
| + | * This mosaic plot can be zoomed in the interactive dashboard. | ||
| + | * '''From the graph, we can tell CUT_BRUISES and CRUSHING are the 2 major nature of the injury cases of all the industry. Noticeably, Marine has very high "Multiple Injuries" rate and Mining has high "CONCUSSION" rate. This may be caused by the unique characters of the industries.''' | ||
| + | [[File:Mosaic type-industry.png]] | ||
| + | |||
| + | ===Further Explore:Body Part Injuries === | ||
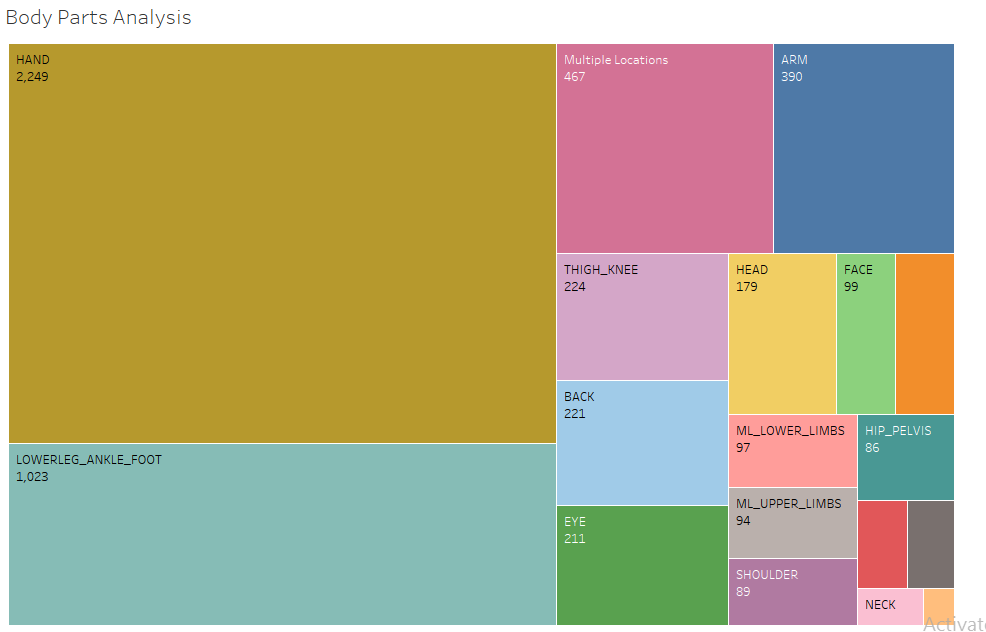
| + | * By Using Treemap, we are able to see the distribution of Body parts injured by color coding. We can easily tell the most injured body parts by the size of the blocks | ||
| + | * '''From the graph, we can tell HAND and LOWERLEG ANKLE FOOT are the 2 major injured body parts. This treemap can be further splitted by selecting specific industry''' | ||
| + | [[File:bodypart-analysis.png]] | ||
| + | |||
| + | ==2.What characteristics do the victim groups have?== | ||
| + | * We create age bin groups to find out the age distribution and add color code to differentiate genders | ||
| + | '''* From the graph, we can tell most of the victims are male and with age 25-30. This may because the "high injury rate" industries mainly hires male employees.''' | ||
| + | [[File:Victim-gender -age.png]] | ||
| − | = | + | ==3.Does Company size matter?== |
| + | * We create sub groups according to Informant number of employees, for companies with less than 150 employees, we assign label "SME" and the rest as "Larger Company".We use '''TableLens''' to plot the number of cases and median days of MC by nature of injuries. | ||
| + | '''* From the graph, we can tell SMEs has higher cases of injuries in all kinds of injury as compared to larger companies. SMEs give on average 1-3 more days MC for each type of injuries as compared to larger companies.''' | ||
| + | [[File:Company size vs Nature od injury and Number of cases.png]] | ||
| + | <br> | ||
| − | === | + | = Final Dashboards = |
| + | The Final Dashboard can be accessed at https://public.tableau.com/profile/publish/MA2_YangChengzhen/FinalDashboard#!/publish-confirm | ||
| + | ==1.Industry & Injury Type Analysis== | ||
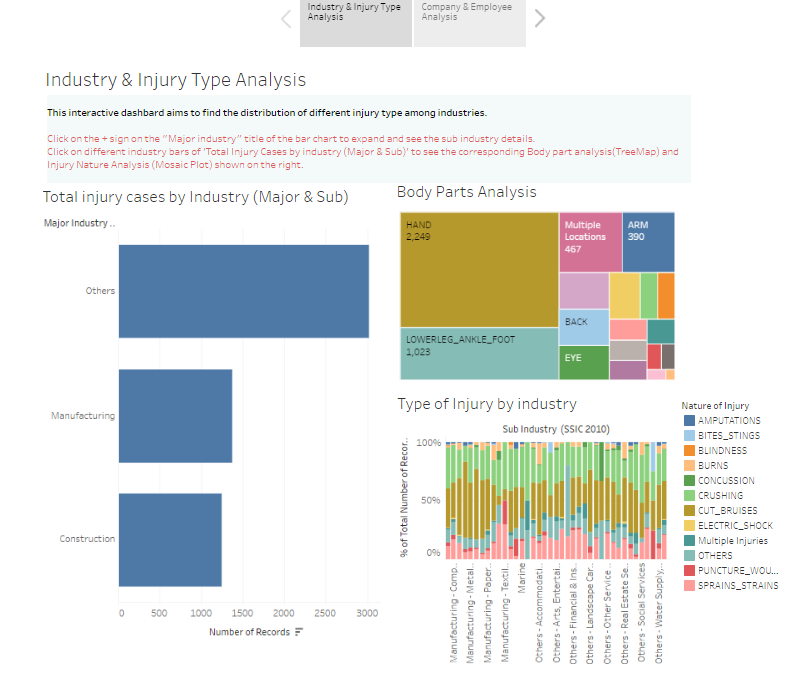
| + | * This interactive dashbard aims to find the distribution of different injury type among industries. | ||
| + | * Click on the + sign on the "Major industry" title of the bar chart to expand and see the sub industry details. | ||
| + | * Click on different industry bars of 'Total Injury Cases by industry (Major & Sub)' to see the corresponding Body part analysis(TreeMap) and Injury Nature Analysis (Mosaic Plot) shown on the right. | ||
| + | [[File:czyang_db1.png]] | ||
| + | ==2.Company & Employee Analysis== | ||
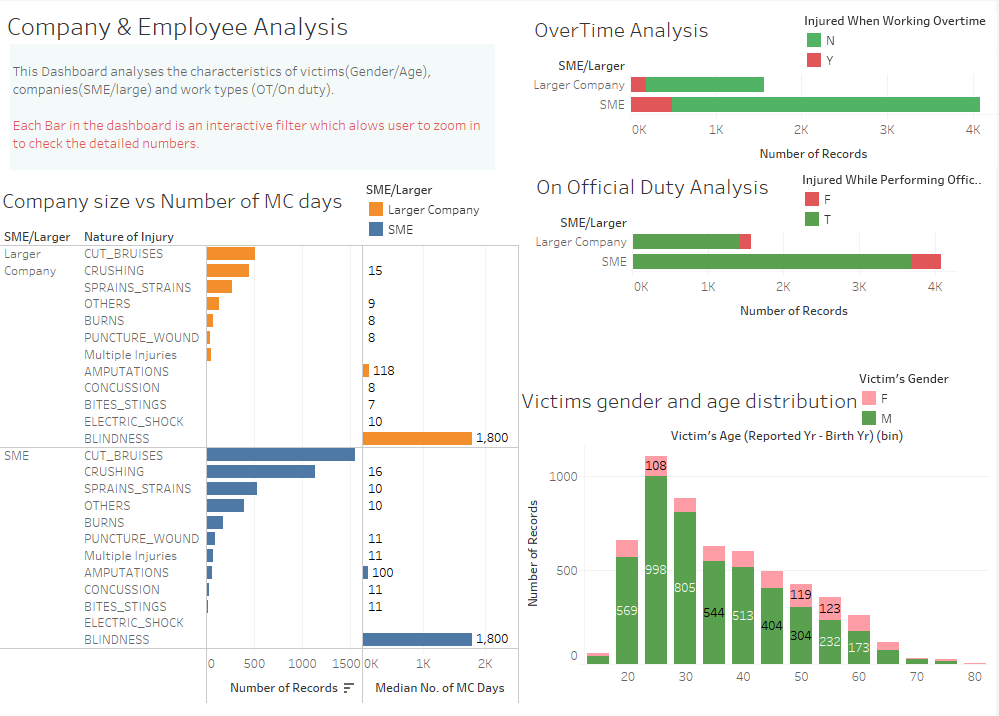
| + | * This Dashboard analyses the characteristics of victims(Gender/Age), companies(SME/large) and work types (OT/On duty). | ||
| + | * Each Bar in the dashboard is an interactive filter which alows user to zoom in to check the detailed numbers. | ||
| + | [[File:czyang_db2.png]] | ||
= Conclusion = | = Conclusion = | ||
| + | Based on the analysis given, we are able to provide following findings to facilitate MOM on improving the MSH performance. | ||
| + | * Cut Bruises and Crushing are the 2 major types of injury, which may need higher medical investment than the rest types. | ||
| + | * Construction,Metalworking, Accommodation and Wholesale&Retail Trade are the most vulnerable industries. | ||
| + | * Male employees with age 25-30 has the highest number of injury cases. | ||
| + | * SMEs tend to have more injury cases | ||
| + | * SMEs tend to give more days of MC | ||
| + | |||
| + | Thus MOM can provide customized insurance/subsidy planning by the nature of industry/company size/employee type based on the findings. | ||
| + | |||
| + | = Tools = | ||
| + | * JMP Pro : Data preparation and visualization | ||
| + | * Treemap : visualization | ||
| + | * Tableau: visulization | ||
= Comments = | = Comments = | ||
Latest revision as of 22:41, 17 October 2016
Contents
Description
Abstract
Workplace Safety and Health has always been one of the top concern of Ministry of Manpower. To better manage MSH, MOM established Workplace Safety and Health (WSH) Council on 1 Apr 2008. WSH Concil coordinates with MOM to conduct research on workplace safety and health performance in Singapore. The WSH Institute conducts quality applied research and provides evidence-based information to Ministry of Manpower, WSH Council and industry stakeholders to improve WSH practices in Singapore. The data used were collated from incident reports made by employers, occupiers and medical practitioners.
This Assignment will generate analysis utilizing WSHI work place injuries data in year 2014 to gain insights of workplace safety and health situation in 2014.
Theme of Interest
In order to be more efficient in improving workplace safety and health situation, it is essential to find out the 'Vulnerable groups' and characteristics tied with different groups. Therefore MOM can provide customized plans in order to prevent the happens of injuries and react to injuries faster and smarter.
This assignment aims to find out the major vulnerable groups and peak period of workplace injury cases to facilitate MOM's customization of planning and policy-making.
Research Question
- How does injuries distribute in different industries?
- What characteristics do the victim groups have?
- Does Company size matter in number of injuries?
- Are companies with different size indifferent with MC policy?
Data Preparation
Attribute Selection
There are 48 columns in the raw data. After scanning through, I selected some attributes which are more relevant in identifying victim groups:
- Nature of Injury
- Major Industry
- Sub Industry
- Victim's Age
- Victim's Gender
- Informant's No of employees
- Injured When Working Overtime
Data Preparation
Check Missing Values
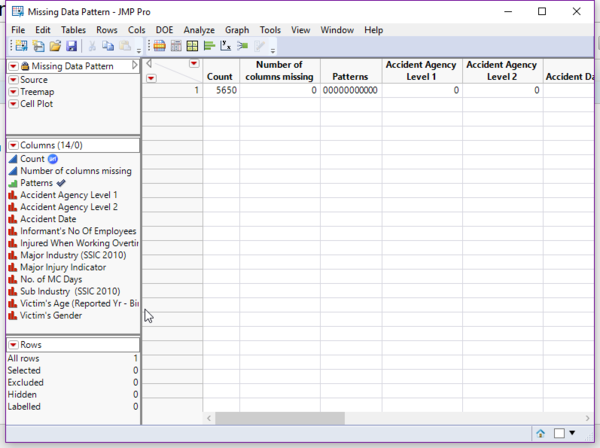
Use JMP to find missing data pattern relating to the attributes selected in the previous section, only one missing data is found. I decided to ignore the record since it has no significant impact to the analysis.
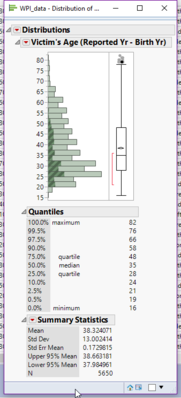
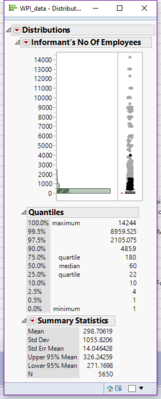
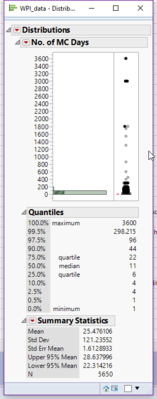
Check Distribution of Numerical Attribute
Data Visualization and Findings
- Access Final outcome here [[1]]
1.How does injuries distribute in different industries?
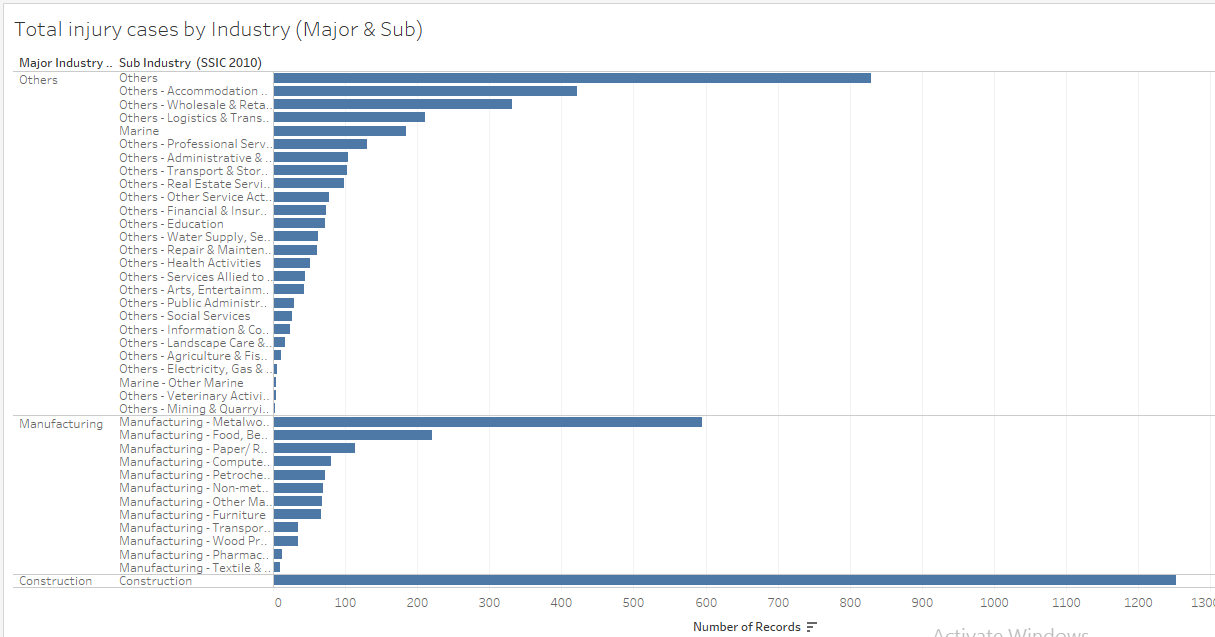
Overview with Injury distribution by industry
- Industry has many categories. In order to have a intuitive view of the distribution of injury, I used hierachy in Tableau to visualize the data.
- From the hierarchical view, we can tell "Construction" has the highest injury cases among all the industries The other 'high injury cases' industries are Metalworking, Accommodation and Wholesale&Retail Trade.
Further Explore:Nature of Injury
- By Using mosaic plot, we are able to see the distribution of nature of injury by color coding. We can check the detailed frequency percentage by mouse over to the corresponding bars
- This mosaic plot can be zoomed in the interactive dashboard.
- From the graph, we can tell CUT_BRUISES and CRUSHING are the 2 major nature of the injury cases of all the industry. Noticeably, Marine has very high "Multiple Injuries" rate and Mining has high "CONCUSSION" rate. This may be caused by the unique characters of the industries.
Further Explore:Body Part Injuries
- By Using Treemap, we are able to see the distribution of Body parts injured by color coding. We can easily tell the most injured body parts by the size of the blocks
- From the graph, we can tell HAND and LOWERLEG ANKLE FOOT are the 2 major injured body parts. This treemap can be further splitted by selecting specific industry
2.What characteristics do the victim groups have?
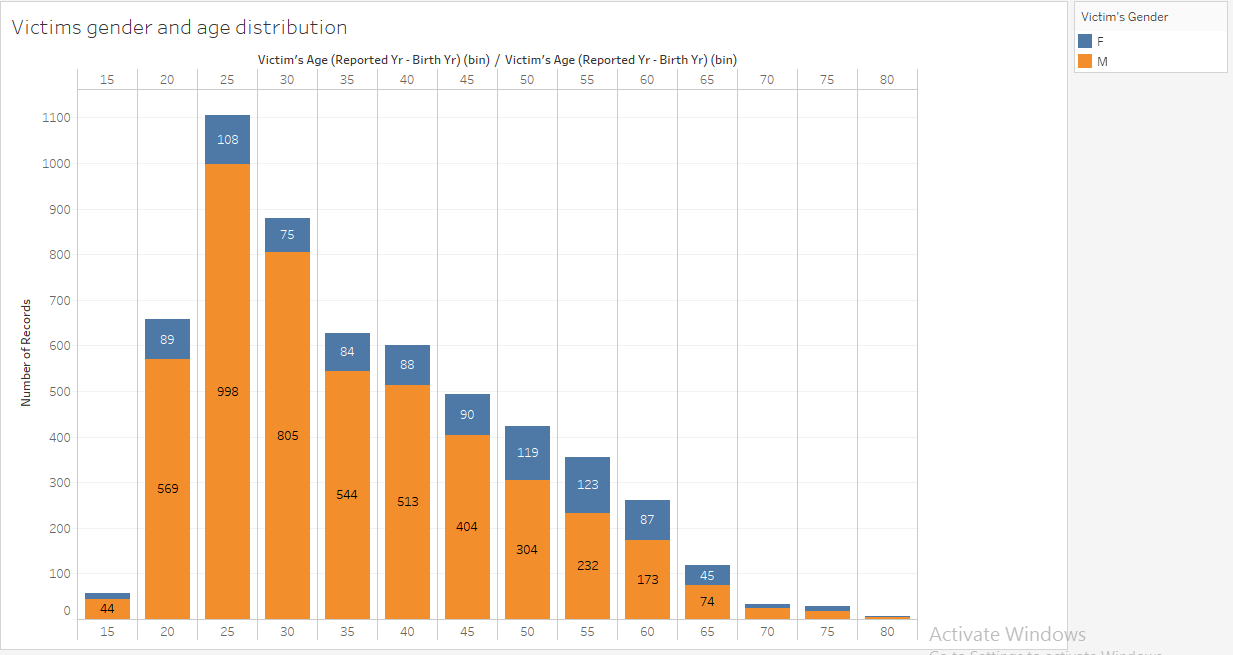
- We create age bin groups to find out the age distribution and add color code to differentiate genders
* From the graph, we can tell most of the victims are male and with age 25-30. This may because the "high injury rate" industries mainly hires male employees.
3.Does Company size matter?
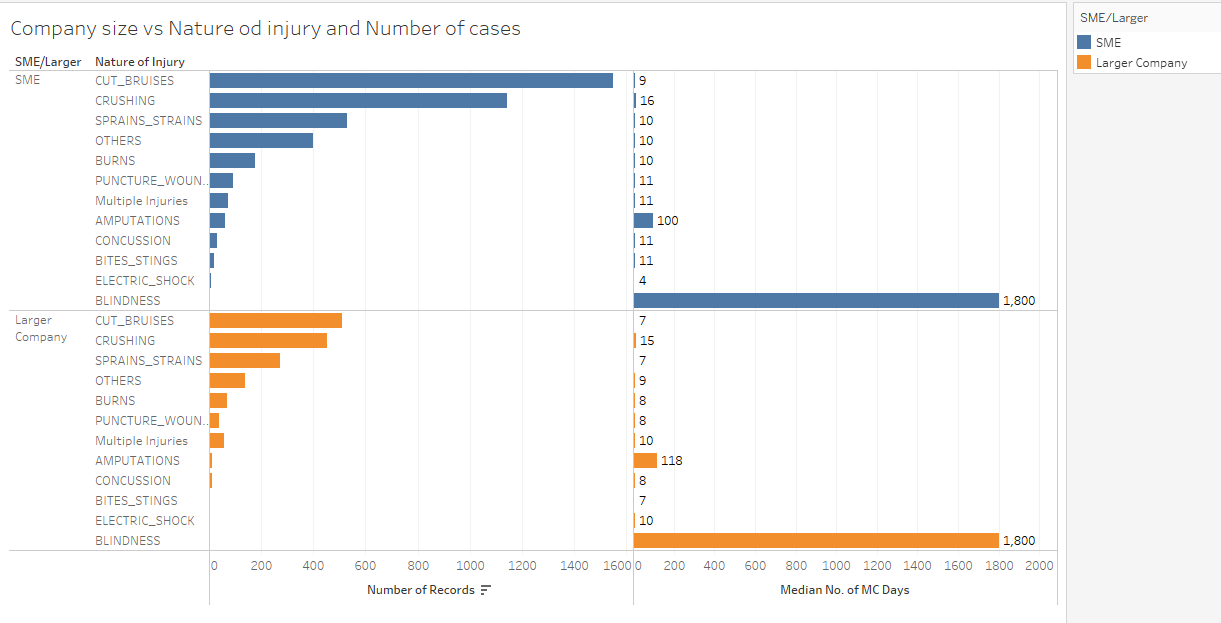
- We create sub groups according to Informant number of employees, for companies with less than 150 employees, we assign label "SME" and the rest as "Larger Company".We use TableLens to plot the number of cases and median days of MC by nature of injuries.
* From the graph, we can tell SMEs has higher cases of injuries in all kinds of injury as compared to larger companies. SMEs give on average 1-3 more days MC for each type of injuries as compared to larger companies.
Final Dashboards
The Final Dashboard can be accessed at https://public.tableau.com/profile/publish/MA2_YangChengzhen/FinalDashboard#!/publish-confirm
1.Industry & Injury Type Analysis
- This interactive dashbard aims to find the distribution of different injury type among industries.
- Click on the + sign on the "Major industry" title of the bar chart to expand and see the sub industry details.
- Click on different industry bars of 'Total Injury Cases by industry (Major & Sub)' to see the corresponding Body part analysis(TreeMap) and Injury Nature Analysis (Mosaic Plot) shown on the right.
2.Company & Employee Analysis
- This Dashboard analyses the characteristics of victims(Gender/Age), companies(SME/large) and work types (OT/On duty).
- Each Bar in the dashboard is an interactive filter which alows user to zoom in to check the detailed numbers.
Conclusion
Based on the analysis given, we are able to provide following findings to facilitate MOM on improving the MSH performance.
- Cut Bruises and Crushing are the 2 major types of injury, which may need higher medical investment than the rest types.
- Construction,Metalworking, Accommodation and Wholesale&Retail Trade are the most vulnerable industries.
- Male employees with age 25-30 has the highest number of injury cases.
- SMEs tend to have more injury cases
- SMEs tend to give more days of MC
Thus MOM can provide customized insurance/subsidy planning by the nature of industry/company size/employee type based on the findings.
Tools
- JMP Pro : Data preparation and visualization
- Treemap : visualization
- Tableau: visulization
