Difference between revisions of "IS428 2016-17 Term1 Assign1 Liu Bowei"
| (11 intermediate revisions by the same user not shown) | |||
| Line 1: | Line 1: | ||
==Abstract== | ==Abstract== | ||
| − | + | This project aims to analyze Singapore's Private Residential supply and price distribution to gain insights on the current state of Singapore's real estate economy. Using the insights gained, I would then attempt to provide some policy recommendations that may help improve the current state of the economy. Data used in this analysis will be collected from REALIS Database, and Tableau would be used to help with visual analysis of the data. Throughout this project, we would realise that there is a surplus of supply in the Condominium and Apartment property types, and that we should increase demand for these property types, or limit the growth of supply of these property types. | |
==Problem and Motivation== | ==Problem and Motivation== | ||
| Line 33: | Line 33: | ||
Looking at the average unit price across all property types, we can see that Apartments have the highest unit price, followed by Condominiums. | Looking at the average unit price across all property types, we can see that Apartments have the highest unit price, followed by Condominiums. | ||
| + | |||
| + | ====Pattern 2==== | ||
| + | [[File:BWPic8.png|600px]] | ||
| + | |||
| + | From this pareto chart, we can see that Condominium and Apartment sales makes up the majority (79.84%) of Private Property Sales Revenue. Revenue from solely Condominium Sale make up nearly half (51.76%) of Private Property Sales Revenue. Therefore, it can be concluded that high vacancy rate in these two property types is extremely detrimental to our economy. | ||
====Pattern 3==== | ====Pattern 3==== | ||
| − | [[File: | + | [[File:BWPic3.png|600px]] |
| − | + | ||
[[File:BWPic4.png|600px]] | [[File:BWPic4.png|600px]] | ||
| − | When comparing | + | |
| − | + | When comparing the graph "Distribution of Average Unit Price of Private Property" with "Vacancy Rate Per Quarter for Each Region", we can see that despite the decreasing average unit price for Condominiums in the East Region, vacancy has been increasing steadily. likewise, in the North East region, we can see that a sharp increase in average unit price for Apartments resulted in a sharp increase in vacancy rate. | |
==Tools Utilized== | ==Tools Utilized== | ||
| + | Tableau is used in this project to assist in visualizing the data, so as to make identifying patterns and trends easier. | ||
| + | Excel and JMP is used to process raw data into a form that makes visualizing in Tableau easier. | ||
==Results== | ==Results== | ||
| − | [[File: | + | Policy Recommendation 1: The fact that the vacancy rate of condominiums in the East Region is increasing despite the decreasing Average Unit Price of Condominiums in that regions is troubling. This shows that there is a considerable surplus in terms of Condominium units. Therefore the rate of increase of Condominiums in the East Region should be controlled. |
| + | |||
| + | Policy Recommendation 2: The sudden increase in average unit price for the Apartments in the North East region had caused a sharp increase in vacancy rate. The increase in average unit price for the Apartments in the North East Region should be controlled to stimulate demand for apartments so as to decrease the vacancy rate. | ||
| + | |||
| + | Policy Recommendation 3: The average unit price of Apartments in Singapore should be controlled, as it has exceeded Condominiums, which has better facilities and should thus be more expensive. Furthermore, Apartments has the highest vacancy rate, and a drop in price may stimulate an increase in demand. | ||
| + | |||
| + | Infograph: | ||
| + | |||
| + | [[File:BWInfo2.png|600px]] | ||
Latest revision as of 08:23, 29 August 2016
Contents
Abstract
This project aims to analyze Singapore's Private Residential supply and price distribution to gain insights on the current state of Singapore's real estate economy. Using the insights gained, I would then attempt to provide some policy recommendations that may help improve the current state of the economy. Data used in this analysis will be collected from REALIS Database, and Tableau would be used to help with visual analysis of the data. Throughout this project, we would realise that there is a surplus of supply in the Condominium and Apartment property types, and that we should increase demand for these property types, or limit the growth of supply of these property types.
Problem and Motivation
Singapore is a small country (719 Square Kilometers), with a growing population (5.54 million). Finding ways to house such a large number of citizens on such limited land is a valid concern, and the country needs to be able to use its remaining undeveloped lands wisely. As such, urban planning is important, especially in terms of housing. Using transaction data from the REALIS Database, I intend to identify patterns in the price and supply of private residential properties.
Approaches
Pattern 1
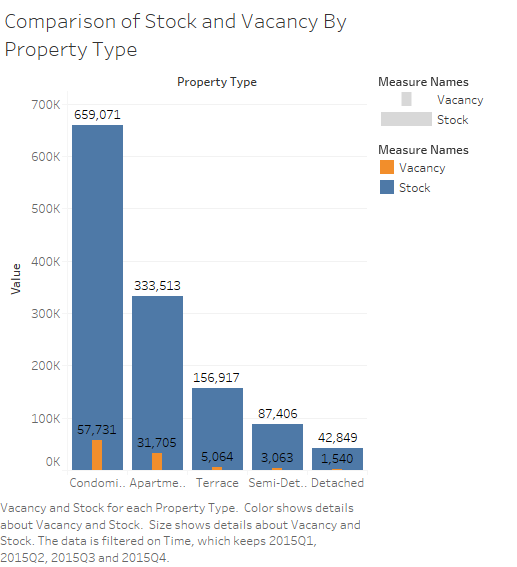
To get a glimpse of how the supply of private residential properties is distribution across the different property types, I created a bar graph with property type and the x-axis and number of units as the y-axis. We can see from this graph that Condominiums and Apartments make up a majority of the supply.
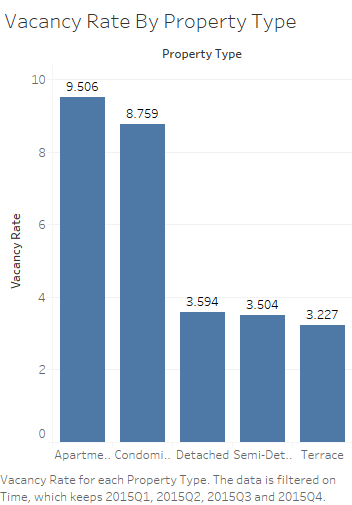
I then created a bar chart to visualize the vacancy rate for each property type. The vacancy rate for Apartments and Condominiums are significantly higher than the other property types, with vacancy rate in Apartments being the highest.
Pattern 2
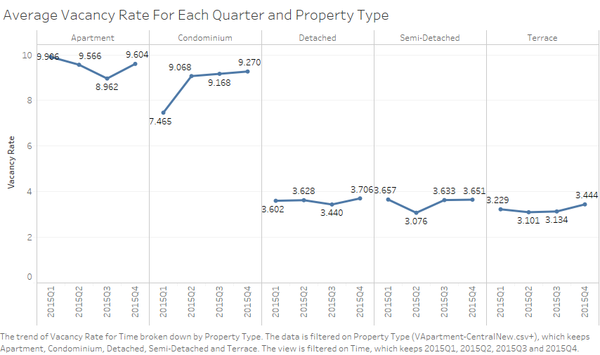
There is a general increasing trend for the vacancy rate for Condominiums, Detached and Terrace. The increasing trend is especially obvious with Condominiums, increasing by almost 2 percent in 1 year. Another point to note is that although there is a general decreasing trend for Apartments, there is a sharp increase in vacancy rate in the last quarter of the year. I have thus decided to focus on the high vacancy rate in the two non-landed property types due to their high number of vacancies, as well as the increasing trend of vacancy rate.
Pattern 3
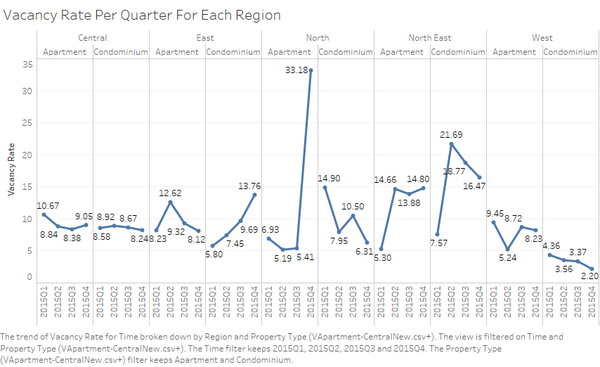
I plotted distribution of the vacancy rate for the property types of Apartment and Condominium for each region. There is a sharp rise in vacancy for Condominium in the East Region and for Apartment in the North Region. Furthermore, vacancy for both property types in the North East Region remains high, despite drops in its vacancy for the third and fourth quarter of the year.
Analyzing distribution of private properties prices
Pattern 1
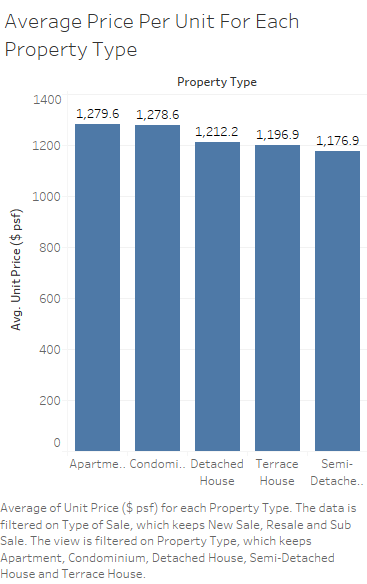
Looking at the average unit price across all property types, we can see that Apartments have the highest unit price, followed by Condominiums.
Pattern 2
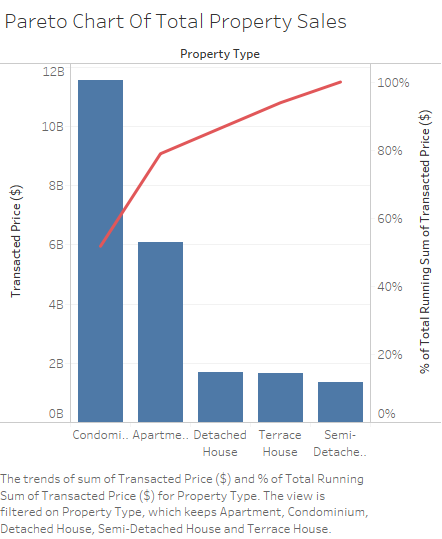
From this pareto chart, we can see that Condominium and Apartment sales makes up the majority (79.84%) of Private Property Sales Revenue. Revenue from solely Condominium Sale make up nearly half (51.76%) of Private Property Sales Revenue. Therefore, it can be concluded that high vacancy rate in these two property types is extremely detrimental to our economy.
Pattern 3
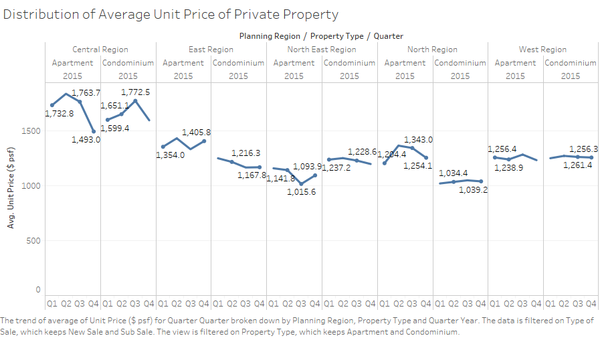
When comparing the graph "Distribution of Average Unit Price of Private Property" with "Vacancy Rate Per Quarter for Each Region", we can see that despite the decreasing average unit price for Condominiums in the East Region, vacancy has been increasing steadily. likewise, in the North East region, we can see that a sharp increase in average unit price for Apartments resulted in a sharp increase in vacancy rate.
Tools Utilized
Tableau is used in this project to assist in visualizing the data, so as to make identifying patterns and trends easier.
Excel and JMP is used to process raw data into a form that makes visualizing in Tableau easier.
Results
Policy Recommendation 1: The fact that the vacancy rate of condominiums in the East Region is increasing despite the decreasing Average Unit Price of Condominiums in that regions is troubling. This shows that there is a considerable surplus in terms of Condominium units. Therefore the rate of increase of Condominiums in the East Region should be controlled.
Policy Recommendation 2: The sudden increase in average unit price for the Apartments in the North East region had caused a sharp increase in vacancy rate. The increase in average unit price for the Apartments in the North East Region should be controlled to stimulate demand for apartments so as to decrease the vacancy rate.
Policy Recommendation 3: The average unit price of Apartments in Singapore should be controlled, as it has exceeded Condominiums, which has better facilities and should thus be more expensive. Furthermore, Apartments has the highest vacancy rate, and a drop in price may stimulate an increase in demand.
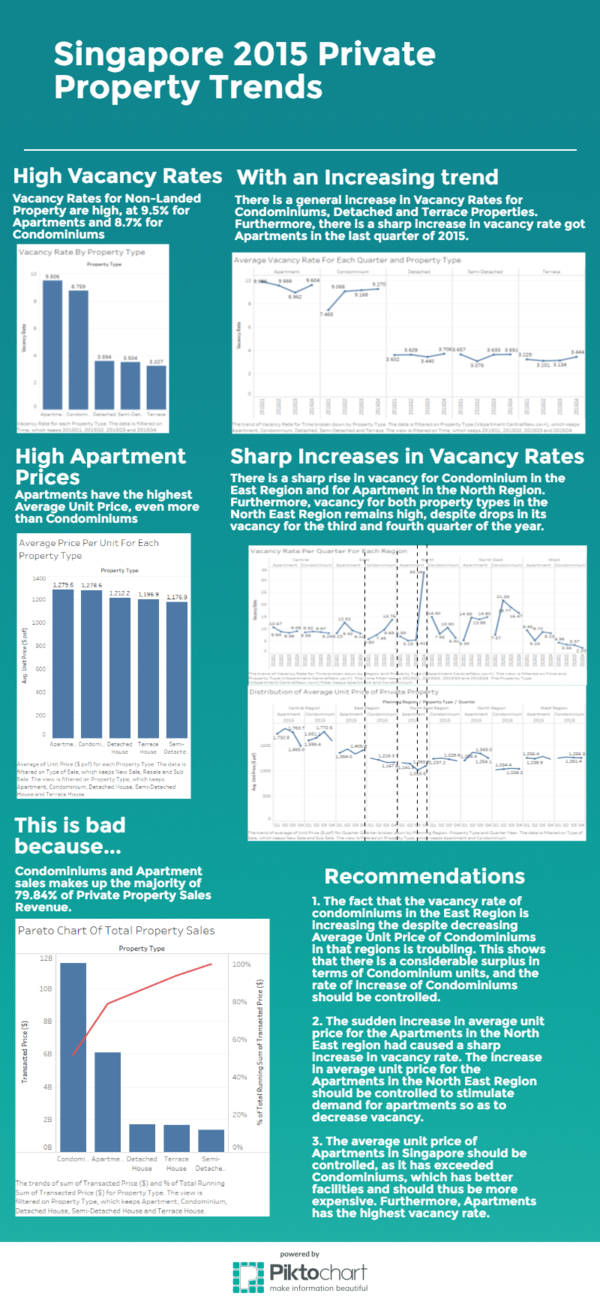
Infograph:
