|
|
| (2 intermediate revisions by the same user not shown) |
| Line 1: |
Line 1: |
| | + | |
| | == Abstract == | | == Abstract == |
| | This project aims to analyze the housing market in Singapore. With special cooling measures and TDSR framework, supply and demand of private poverty are slightly changing now. Through data visualization, we can clearly see the trend happening in private poverty market. Some policy recommendations might be helpful to attract investment and keep housing market thriving. | | This project aims to analyze the housing market in Singapore. With special cooling measures and TDSR framework, supply and demand of private poverty are slightly changing now. Through data visualization, we can clearly see the trend happening in private poverty market. Some policy recommendations might be helpful to attract investment and keep housing market thriving. |
| | | | |
| | == Problem and Motivation == | | == Problem and Motivation == |
| − | Prices of private homes fell 3.7 percent for the whole of 2015, according to data released by the Urban Redevelopment Authority (URA). Despite the fact that prices had dropped, and every Singaporeans would want to own a private property, the vacancy rates of private properties are still remaining high. Private properties are seen to be a good investment for many Singaporeans; however, the prices of private properties can be ranged from moderate to super expensive based on the regions/areas in Singapore. Hence, only high-income individuals/Singaporeans can afford to purchase them.
| + | |
| − | Furthermore, with fewer jobs being created, there has been a relatively lesser influx of expatriates moving to Singapore, which has caused a fluctuation in demand and supply. Expatriates, who jobs have been affected, have also moved out of Singapore. This has led to an increase in supply of home units.
| + | Singapore property market has been slackening since 2013, tempered by the government initiated cooling measures and a series "tax" fee. In the meantime, government did not stop to supply the poverty market which results in the over-supply problem in the poverty market. |
| − | In order to prevent this situation from occurring, it would not be meaningful to price new units based on what developers think is profitable, but rather more on what is affordable to buyers to drive sales. Therefore, it is imperative to closely analyze the private properties regions and introduce new policies or improvements, so that it will be a win-win situation for the potential buyers, developers, and the government.
| + | Additional Buyer's Stamp Duty makes foreign investment bored and uninterested which lost of foreign capital intake. The Total Debt Servicing Ratio is reaching multiple-home owners by requisitions. |
| | + | Flooding cooling measures control the inflammation rate in the property market but freeze the Singapore housing market for a long time. |
| | <br/><br/> | | <br/><br/> |
| | The analysis will identify: | | The analysis will identify: |
| − | * Supply of private property types across different regions and districts. | + | * Growth of available private property supply |
| − | * Distribution of sales prices of private property types across different regions in Singapore based on different quarters in Year 2015. | + | * Trend of price and rental change from 2000 to 2015 |
| | + | * Trend of vacancy rate |
| | + | |
| | <br/> | | <br/> |
| − | This analysis hopes to target on regions and districts in Singapore that has the highest vacancy rates and for potential buyers to have an informed decision when purchasing of private property. | + | This analysis aims to point out the key problem in the housing market now and initiate effective measures. |
| | | | |
| | == Approaches == | | == Approaches == |
| − | It is important to have domain knowledge in order to understand the terminologies used in the datasets. This can be done through the use of internet to research on the definitions and also by reading through some available materials to have a better understanding of the land policies and challenges faced in the current private properties market in Singapore.
| + | I collected relating data from The Urban Redevelopment Authority (URA) REALIS database. Since this analysis focuses on the private poverty effect, I zoomed in the residential property information. Relative data from the database was examined and visualized using Tableau and some trends are obvious to stand out. Combined with the current government policies and society situation, I drew conclusions on the private property market and recommended measures that government could consider to take. |
| − | Subsequently, I have downloaded the statistical report of URA-Property Market Information and extracted data from REALIS database which is purely focusing on the private residential properties. There are 3 different tabs that I had made used of when collecting data for my analysis. They are:
| |
| − | * Time Series – This provides me with a compiled statistics filtered by the different property type that contains data such as Vacancy Rate and Vacancy Stock through the different regions – Central, East, North-East, North, and West from different quarters of the year.
| |
| − | * Transactions – This provides information containing the transacted prices of various property type based on their regions, districts, unit price psf., sales dates, etc.
| |
| − | * Stock – This provides information regarding to the supply of units for each property type based on their regions, areas, and the different quarters of the year.
| |
| | | | |
| − | === Initial Data Cleaning === | + | == Visualisation of Graph == |
| − | Having all these massive amount of complex data, I begin to identify any connections/relevancies/entities between the data by using excel 2010. Certainly, there are some concerns for using the data straight in the raw form are:
| + | === Available and Completed Private Property Units === |
| − | * Removing redundant or irrelevant information and remove extra wordings that may cause Tableau to “misbehave” or show the error status.
| + | [[File:Lwq_growth.png|600pxl]] |
| − | * “Unfriendly” data arrangement that would cause error when raw data is imported straightly into Tableau.
| + | <br> |
| − | Therefore, I cleaned up the data before I import them into Tableau to start generating charts or graphs for the purpose of data visualization.
| + | Before 2013, the number of available and completed private poverty units keeps a balance. After 2013, there is a rapid growth in the available private property which pushes up the number of completed private property. I insert an average line to show the rapid growth after 2013. |
| − | [[Image:LimKimYong CleanData.png|900px]]
| |
| | | | |
| − | == Visualization of Graph == | + | === Change of Price and Rental Index === |
| − | === Supply of Private Properties in Year 2015 === | + | [[File:Price and Rental Index.png|600px]] |
| − | [[Image:LimKimYong Supply.png |350px]]<br> | + | <br> |
| − | While analyzing the dataset from REALIS regarding the different private property types, the number of units, I noticed the supply of Condominiums scored the highest among the other properties that includes Non-Landed property (Apartment) and Landed property(Detached House, Terrace House and Semi-Detached House). Based on my analysis, Singapore is a small island; we could not afford to use large spaces to build landed properties. Therefore, it will be wiser for property developers to build and supply high-rise units like condominiums and apartments. Furthermore, developers can build more units in non-landed property as compare to landed property as they usually can build and produce more units for sale. As a result, there is a skyrocket of supply for non-landed property units compare to landed-property units.
| + | Price index and rental index keep the similar trend according to the booms and busts of economy. From 2013, the price of the private property and the rental of private property are declining slightly. |
| | | | |
| − | === Vacancy Rate based on Regions and Property Type ===
| |
| − | [[Image:LimKimYong Vacancy.png|450px]]<br>
| |
| − | A Line graph is selected for representation because it will allow the reader to easily identify and compare the vacancy rates of different property type based on their regions and the different quarters in the year of 2015. Line graph is preferred over bars/circles because the graph tends to get messy and confusing as there are multiple occasions of overlapping of path. Therefore, by color-coding the lines the reader could easily identify the property types and see the pattern of growth in vacancy rate based on the region.
| |
| − | From the line graph, we observe that the property type of Apartment in the North region has the highest vacancy rate of 33.12%. This observation could be contributed by three reasons:
| |
| − | *The location in North region is not attractive and the price is still slightly expensive than other regions. The area is relatively far from the city, and transport can be challenging due to traffic.
| |
| − | *An apartment is usually smaller and has fewer facilities as compared to condominiums.
| |
| − | *A weak economy in 2015, with tighter foreign manpower policies imposed, and more units coming onto the market might be a factor to the rise of vacancy rate as well.
| |
| | | | |
| − | === Share of private properties by district ===
| |
| − | [[Image:LimKimYong Districts.png|600px]]<br>
| |
| − | A stacked graph is selected for representation because it will allow the reader to easily find out which district has the most number of private residential units based on the total cumulative values across all the property types.
| |
| − | From the stacked graph, we observe that district 10 has the highest share of private properties supply of 169,929 units in the year 2015. This observation result comes as no surprise considering that district 10 is in the Core Central Region (CCR) stretching from Singapore’s Central Business District to Orchard Road, Cairnhill, Tanglin, River Valley, Newton and Bukit Timah. Due to its prime location and convenience, the residential developments in the CCR are priced the highest. Thus, developers will be very keen to supply units in that region so that they could reap high profits for themselves.
| |
| | | | |
| − | === Price Distribution by Regions === | + | === Vacancy Rate Change === |
| − | [[Image:LimKimYong Price.png |800px]][[File:LimKimYong Outliers.png |330px|thumb|right|Condominiums' prices in the Central Region, costs above average throughout all quarters.]]<br>
| + | |
| − | A bar chart is selected for representation because it will help the reader to easily understand the situation quickly and see the skewed difference on each level. Color-codes will help the reader to identify which regions has the highest price distribution (measured by the average transacted price) based on the various property types.From the bar chart, we observed that all private properties in the Central Region have the highest average transacted price across all other regions. This observation result comes as no surprise considering that the Central Region is a prime location and convenience as it is fairly close to the city with excellent shopping venues and local food markets. Furthermore, prices for detached houses remain the highest price throughout all other regions. This might be due to the fact that Singapore is a small country with the scarcity of land. As a quote from Benjamin Graham, “Price is what you pay, and value is what you get”. The larger the space you own, the more expensive it will costs.
| + | [[File:Vancacy.png|200px]] |
| | + | <br> |
| | + | From 2006, the vacancy rate is climbing consistently. More vacant private houses are useless and cause a waste of resource. |
| | + | |
| | + | |
| | + | == Analysis == |
| | + | From the Vacancy Rate chart, we can see the vacancy rate is growing up which means there are more unoccupied property out there. In the meanwhile, Singapore has reached the highest vacancy rate since 10 years ago and released the empty houses without urgent demand. Cooling measures indeed reduce the excessively high house price but also make property developers suffering and keep foreign investors away. Form the available and completed chart we see, under this situation , the available private property is rapidly growing which will intense existing vacancy problem. Because of the slackening housing market, the price and rental cost obviously are declining which could freeze the private property market. |
| | | | |
| | == Tools Utilized == | | == Tools Utilized == |
| − | The following tools were used during the project:
| |
| − | # Microsoft Excel – Data cleaning and transformation so that it can be imported into Tableau for analysis
| |
| − | # Tableau 10.0 – Chart generation and visualization to perform analysis to find patterns
| |
| − | # Photoshop CS6 - Creation of infographic to present complex information quickly and clearly.
| |
| − | # Microsoft Word - Document findings and results
| |
| | | | |
| − | == Infographic ==
| + | # Microsoft Excel – Data cleaning and transformation |
| − | [[File:LimKimYong 01.png]]
| + | # Tableau 10.0 – Chart generation and visualization |
| | + | |
| | | | |
| | ==Suggestions== | | ==Suggestions== |
| − | Follow the "PMW" Approach
| + | * Putting off or Give a break on cooling measures |
| − | * "Wait and See Approach" to reduce the oversupply of private residential units. Governments and developers to slow down the supply of private properties to prevent unnecessary wastage of lands at locations that are not highly attractive. | + | * Encourage people upgrade from HDB flat to condos |
| − | * Moderate of prices and transaction. Introduce rebates or packages to attract make private properties more affordable for the buyers. | + | * Provide guidance and renovation subsidy on private proverty |
| − | * Partner with big companies to reduce vacancy rates. Companies can use these empty spaces as service apartments for their employees or expatriates.
| |
| | | | |
| | == Conclusion == | | == Conclusion == |
| − | In the visualization graphs, we have shown that central region has the highest price and supply of private properties due to its prime location and convenience. Besides, the North region remains as the highest vacancy rates due to poor location.Therefore, the government and property developers should come up with attractive policies such as providing more infrastructures, affordable prices, or even having more shopping malls to attract home-buyers to stay in those less popular regions/areas. This would help to create an equal spread among all other regions and prevent overcrowding in the central region.
| + | From the above charts, we can know that the private property market is facing a lacklustre now. Because of growing approvable construction projects, the problem will still go on. Therefore, we have to adjust our policy to face the challenge. |
Abstract
This project aims to analyze the housing market in Singapore. With special cooling measures and TDSR framework, supply and demand of private poverty are slightly changing now. Through data visualization, we can clearly see the trend happening in private poverty market. Some policy recommendations might be helpful to attract investment and keep housing market thriving.
Problem and Motivation
Singapore property market has been slackening since 2013, tempered by the government initiated cooling measures and a series "tax" fee. In the meantime, government did not stop to supply the poverty market which results in the over-supply problem in the poverty market.
Additional Buyer's Stamp Duty makes foreign investment bored and uninterested which lost of foreign capital intake. The Total Debt Servicing Ratio is reaching multiple-home owners by requisitions.
Flooding cooling measures control the inflammation rate in the property market but freeze the Singapore housing market for a long time.
The analysis will identify:
- Growth of available private property supply
- Trend of price and rental change from 2000 to 2015
- Trend of vacancy rate
This analysis aims to point out the key problem in the housing market now and initiate effective measures.
Approaches
I collected relating data from The Urban Redevelopment Authority (URA) REALIS database. Since this analysis focuses on the private poverty effect, I zoomed in the residential property information. Relative data from the database was examined and visualized using Tableau and some trends are obvious to stand out. Combined with the current government policies and society situation, I drew conclusions on the private property market and recommended measures that government could consider to take.
Visualisation of Graph
Available and Completed Private Property Units
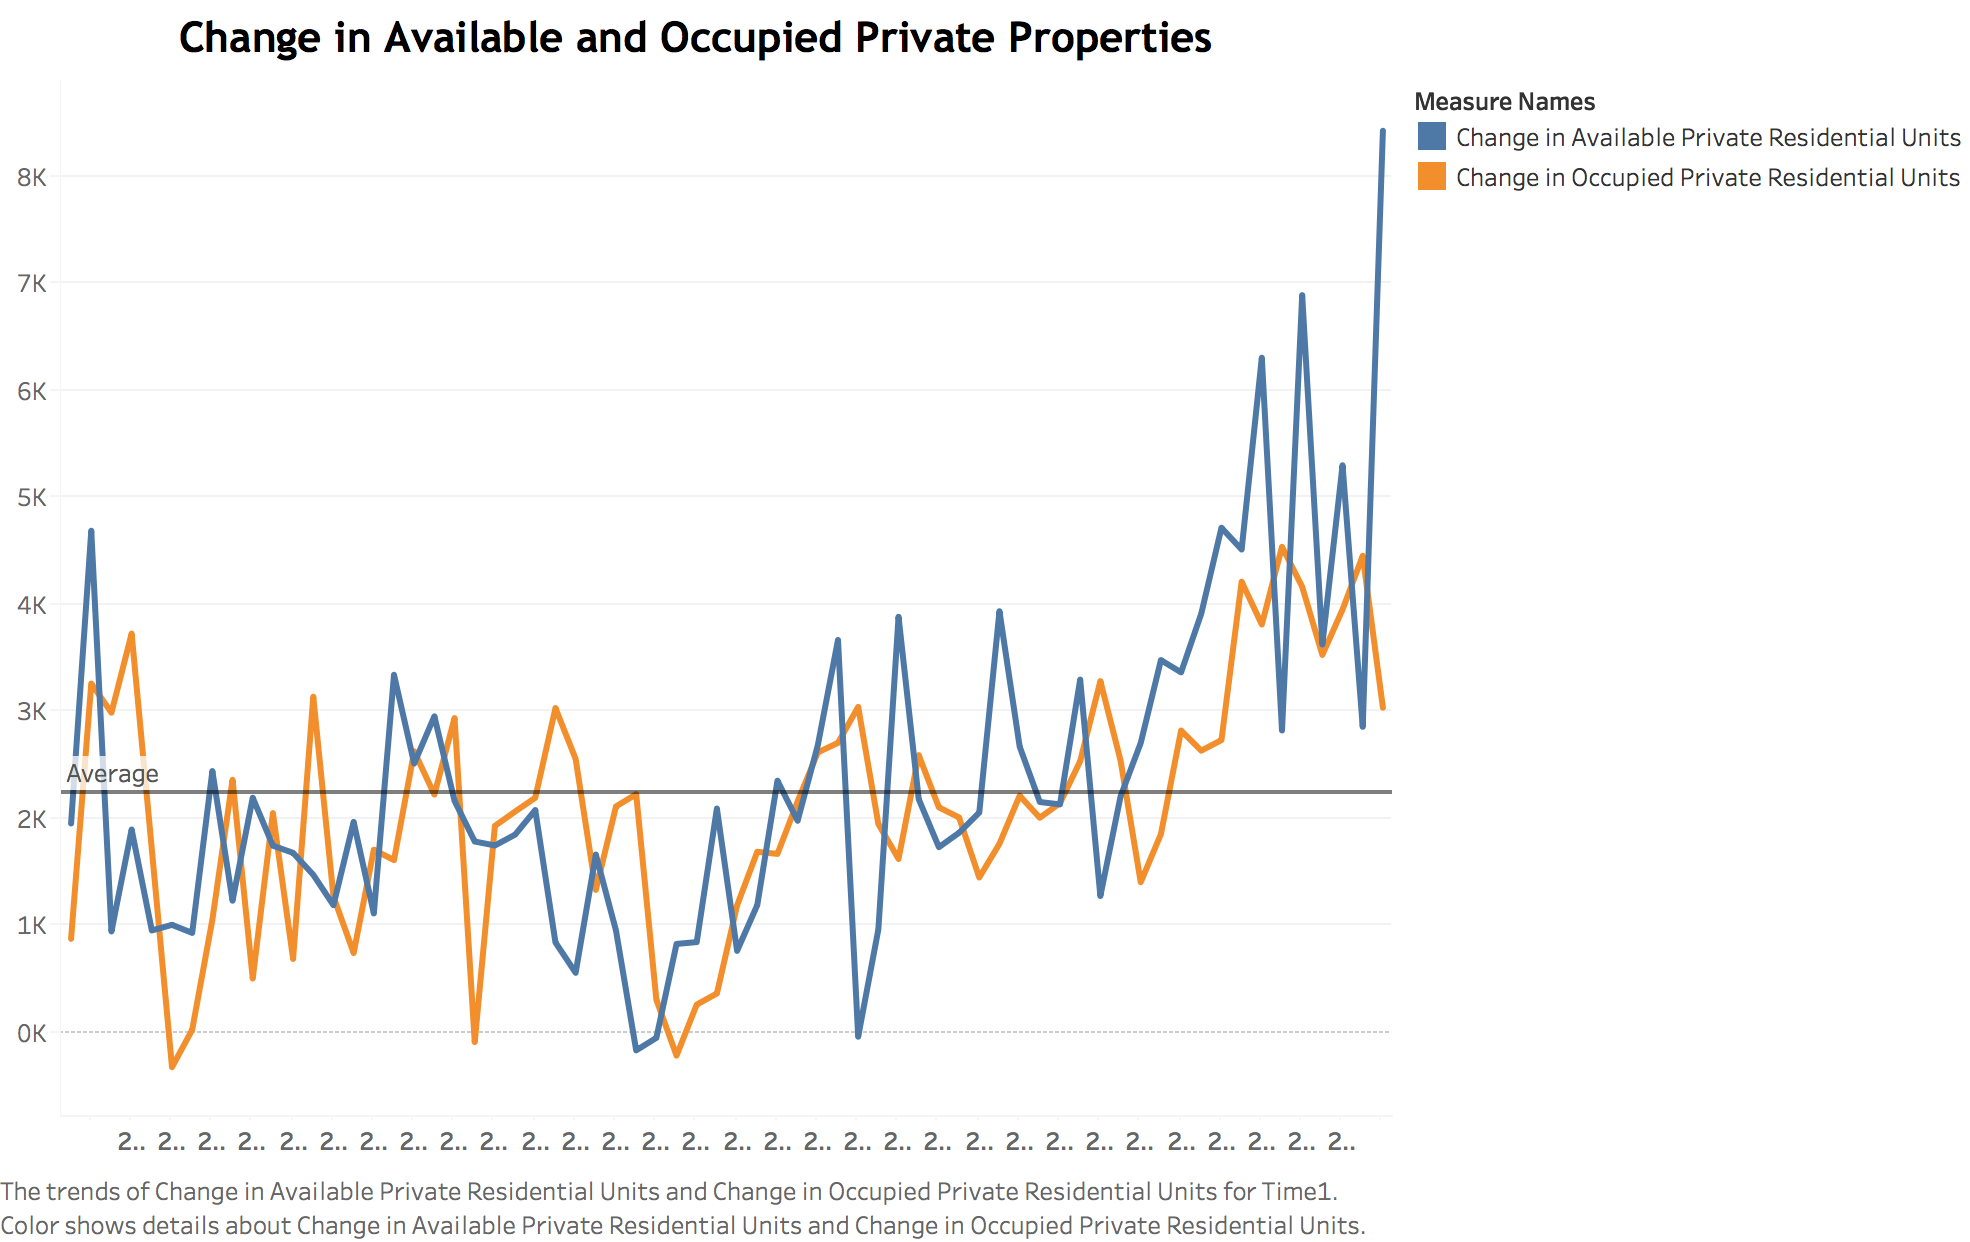
Before 2013, the number of available and completed private poverty units keeps a balance. After 2013, there is a rapid growth in the available private property which pushes up the number of completed private property. I insert an average line to show the rapid growth after 2013.
Change of Price and Rental Index
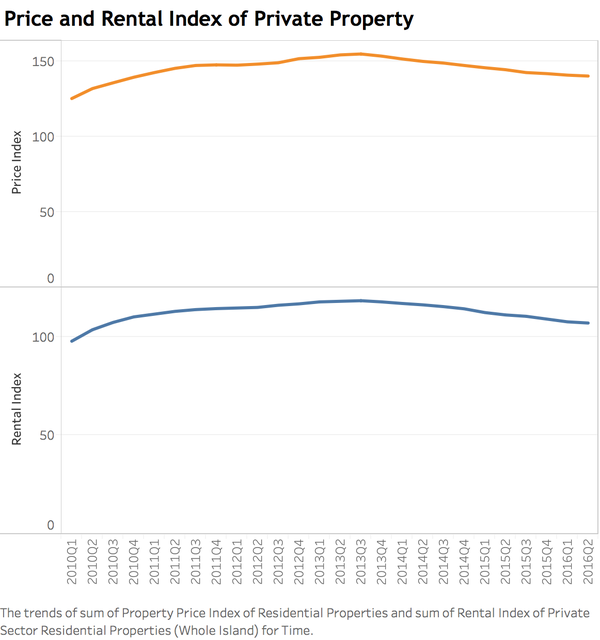
Price index and rental index keep the similar trend according to the booms and busts of economy. From 2013, the price of the private property and the rental of private property are declining slightly.
Vacancy Rate Change
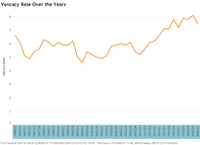
From 2006, the vacancy rate is climbing consistently. More vacant private houses are useless and cause a waste of resource.
Analysis
From the Vacancy Rate chart, we can see the vacancy rate is growing up which means there are more unoccupied property out there. In the meanwhile, Singapore has reached the highest vacancy rate since 10 years ago and released the empty houses without urgent demand. Cooling measures indeed reduce the excessively high house price but also make property developers suffering and keep foreign investors away. Form the available and completed chart we see, under this situation , the available private property is rapidly growing which will intense existing vacancy problem. Because of the slackening housing market, the price and rental cost obviously are declining which could freeze the private property market.
Tools Utilized
- Microsoft Excel – Data cleaning and transformation
- Tableau 10.0 – Chart generation and visualization
Suggestions
- Putting off or Give a break on cooling measures
- Encourage people upgrade from HDB flat to condos
- Provide guidance and renovation subsidy on private proverty
Conclusion
From the above charts, we can know that the private property market is facing a lacklustre now. Because of growing approvable construction projects, the problem will still go on. Therefore, we have to adjust our policy to face the challenge.


