Difference between revisions of "IS428 2016-17 Term1 Assign1 Gwendoline Tan Wan Xin"
Wx.tan.2013 (talk | contribs) |
Wx.tan.2013 (talk | contribs) |
||
| Line 27: | Line 27: | ||
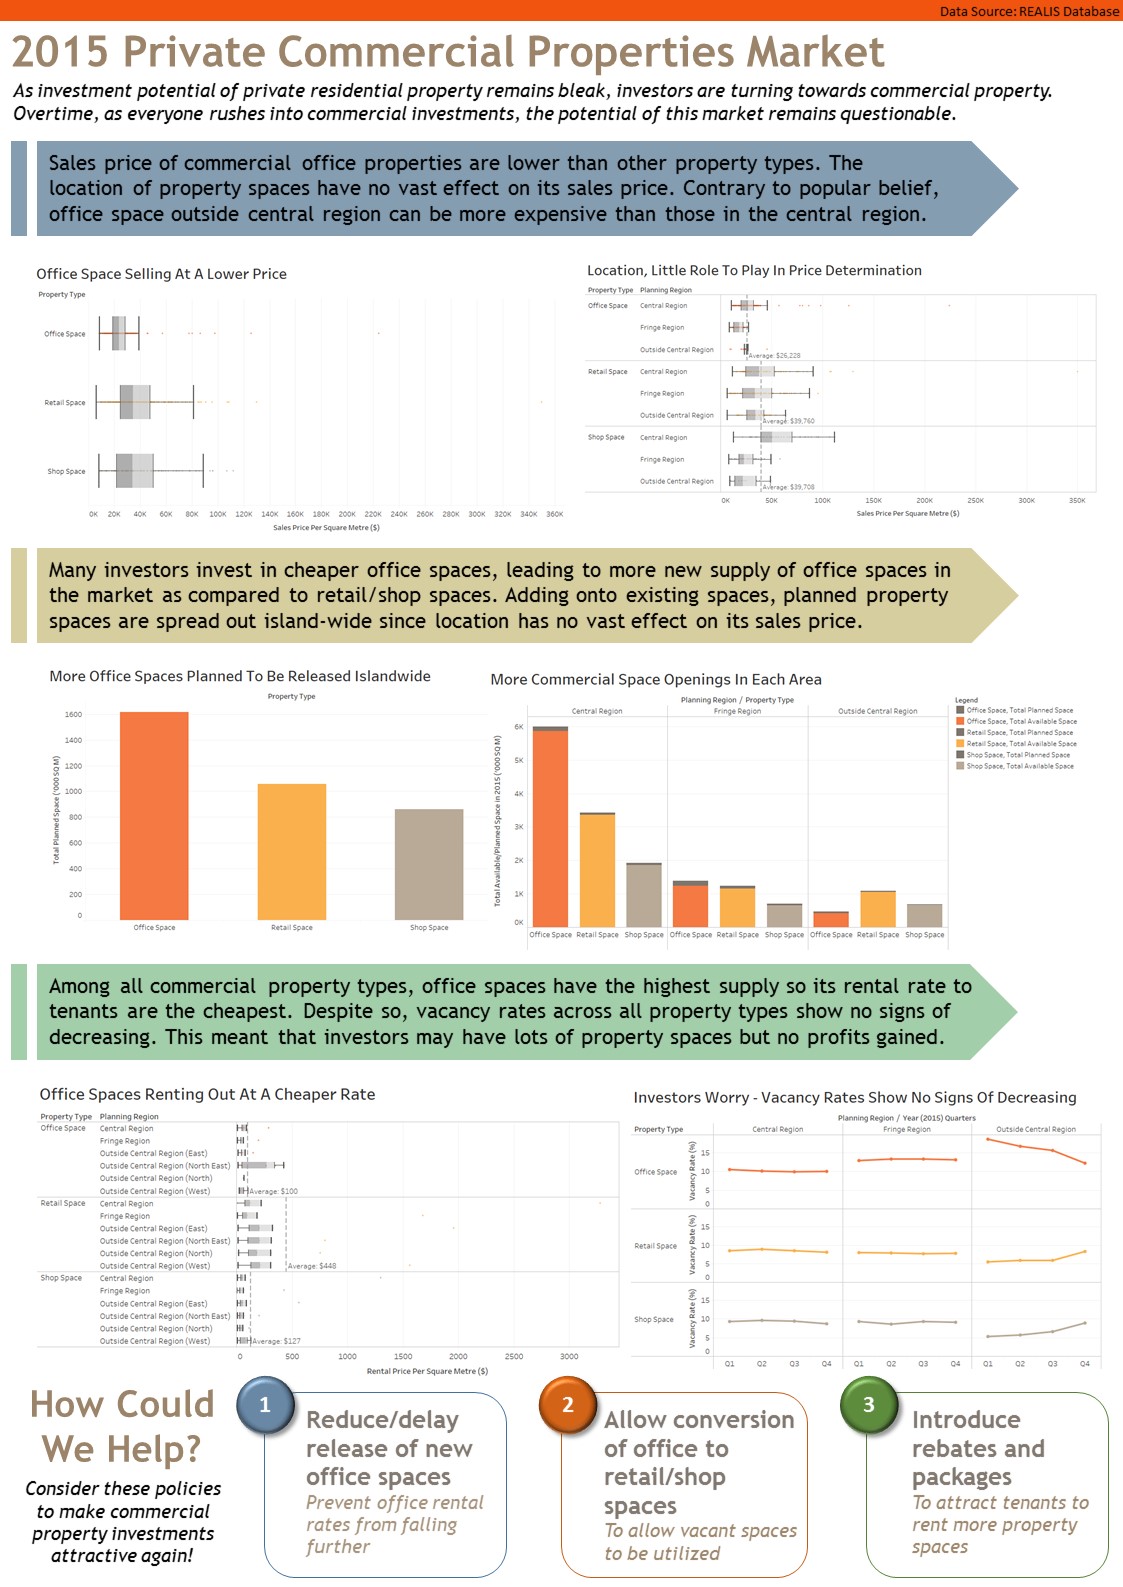
== Infographic == | == Infographic == | ||
| − | + | [[File:MA1 Infographic GwendolineTanWanXin.jpg]] | |
== Results == | == Results == | ||
Revision as of 19:25, 28 August 2016
Abstract
With the introduction of cooling measures in the private residential property market, more property investors are turning into the commercial property market. However, as more people buy and develop commercial properties, the market is getting unfavorable in 2015. An analysis was conducted to identify possible issues in the market. This is important to prevent investors from leaving Singapore, as they continue to lose profits. The analysis shows that supply of property spaces is high but demand for it was low. Vacancy rates across all property types show no signs of decreasing. Although office spaces were cheaper, the vacancy rate remained similar as those in retail/shop spaces. Three policies were then, identified in an attempt to alleviate the situation in 2015.
Problem and Motivation
The Singapore Government has been introducing cooling measures in the private residential market to prevent a real estate bubble burst. As such, many property investors have changed their attention towards commercial property. With majority of investors rushing to invest in the commercial property market, its investment potential remains questionable. In a worst case scenario, property investors may decide to leave Singapore if they feel that they can’t make enough money. This becomes a problem for the government as Singapore relies on local/foreign investments to attract large corporations to its shore. In order to prevent this situation from occurring, it is important to closely analyse the commercial property market situation in 2015. This would allow the government to introduce new policies or make improvements now, so that property investors will continue to stay in Singapore.
The analysis will identify:
- existing/planned supply of private commercial property types
- distribution of sales/rental prices of commercial property types across different regions in Singapore
This analysis hopes to address ways to ensure that land areas in Singapore are used efficiently and that investors will continue to remain in Singapore, despite the economic gloom.
Approaches
REALIS is a large database that provide lots of data. However, downloading all the data will be too time-consuming. As the problem focus is on the commercial property market, I will only look at data related to this segment of the market. Assuming that the commercial property data has been downloaded, this section will detail the approach taken to examine and analyse data.
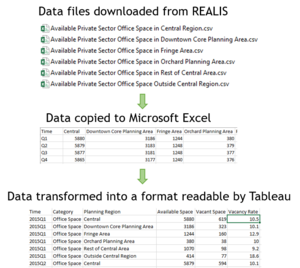
- The data downloaded is split into multiple csv files and it is not ‘analysis-friendly’. As such, a new excel file is created to consolidate all the data in each csv file for analysis to be carried out in Tableau. An example of the data cleaning process is shown on the right.
- The consolidated data is imported into Tableau. Using the drag and drop features in Tableau, a chart is then generated.
- Based on the chart findings, questions start to surface as to why the pattern or trend is happening. Possible reasons such as prices or location which might play a factor in the derivation of the pattern were identified.
- Filters were then further employed to analyse the data into greater detail. If required, more data is then collected to be used for analysis in order to identify a probable solution for the trend that is happening.
- The entire process of chart generation, identifying trends and finding reasons repeats until possible reasons about the trend happening has been identified.
Tools Utilized
The following tools are used during the project:
- Microsoft Excel – Data cleaning and transformation so that it can be imported into Tableau for analysis
- Tableau – Chart generation and analysis
- Microsoft PowerPoint – Creation of analytical infographic

